 9
9peptides
spectra
0.024 | 0.033
0.000 | 0.000
0.007 | 0.016
0.812 | 0.820
0.000 | 0.000
0.000 | 0.000
0.139 | 0.147
0.000 | 0.000
| Plot | Mito | Lyso | Perox | ER | Golgi | PM | Cytosol | Nucleus | |||||
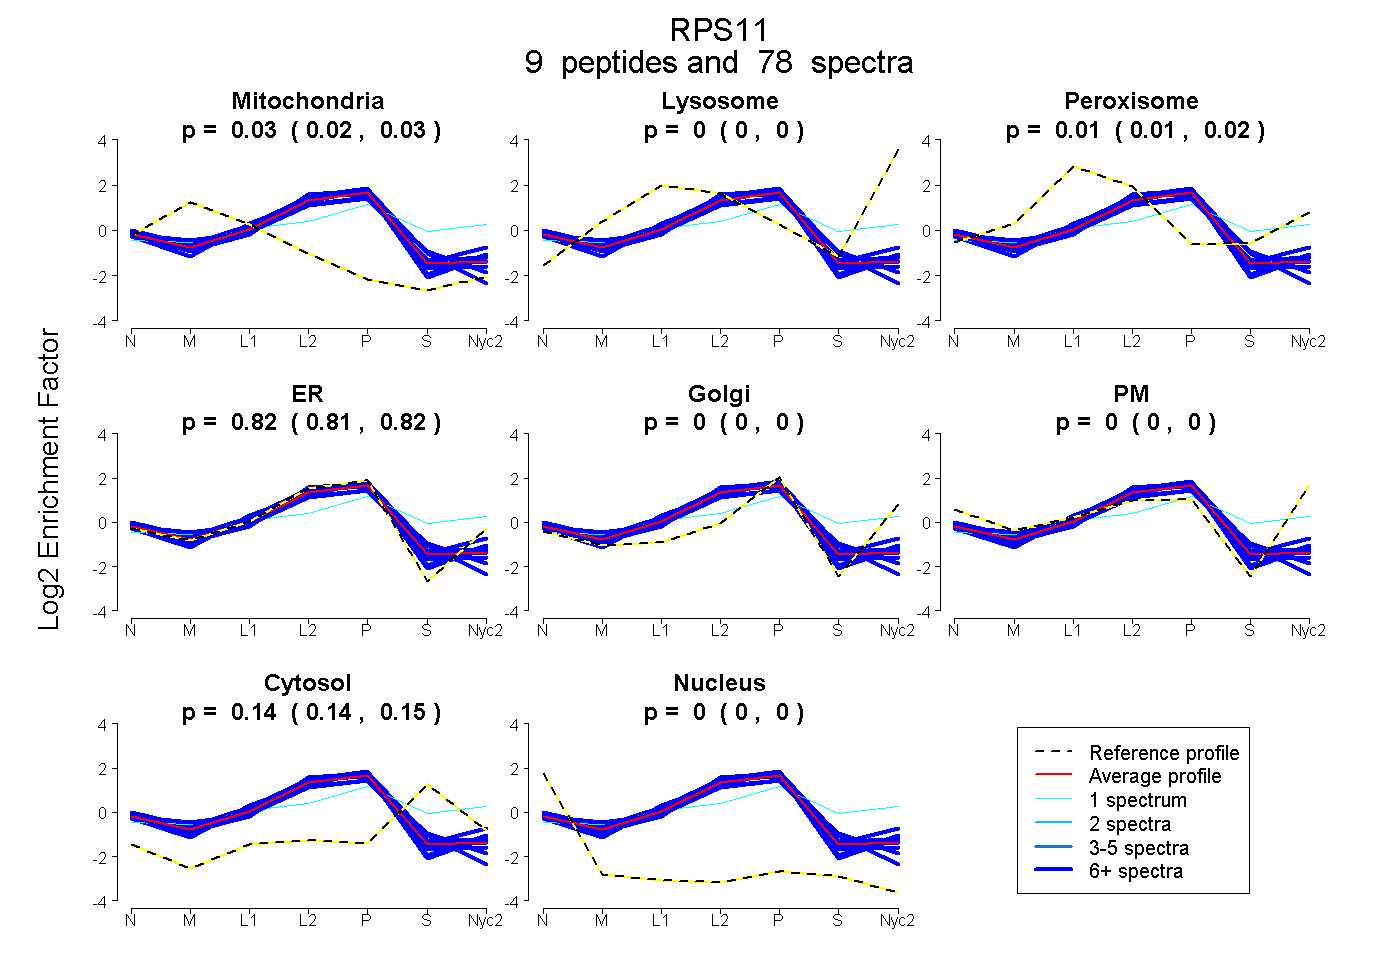
| Expt A |
9 peptides |
78 spectra |
|
0.029 0.024 | 0.033 |
0.000 0.000 | 0.000 |
0.012 0.007 | 0.016 |
0.816 0.812 | 0.820 |
0.000 0.000 | 0.000 |
0.000 0.000 | 0.000 |
0.144 0.139 | 0.147 |
0.000 0.000 | 0.000 |
| 7 spectra, EAIEGTYIDK | 0.009 | 0.000 | 0.034 | 0.714 | 0.000 | 0.000 | 0.210 | 0.033 | ||
| 13 spectra, CPFTGNVSIR | 0.042 | 0.000 | 0.000 | 0.861 | 0.000 | 0.000 | 0.097 | 0.000 | ||
| 10 spectra, VLLGETGK | 0.079 | 0.000 | 0.028 | 0.738 | 0.000 | 0.000 | 0.155 | 0.000 | ||
| 1 spectrum, NMSVHLSPCFR | 0.000 | 0.000 | 0.316 | 0.022 | 0.423 | 0.000 | 0.238 | 0.000 | ||
| 8 spectra, QPTIFQNK | 0.000 | 0.000 | 0.011 | 0.900 | 0.000 | 0.000 | 0.081 | 0.009 | ||
| 8 spectra, DVQIGDIVTVGECRPLSK | 0.001 | 0.000 | 0.000 | 0.782 | 0.000 | 0.000 | 0.200 | 0.017 | ||
| 9 spectra, DYLHYIR | 0.052 | 0.000 | 0.000 | 0.886 | 0.000 | 0.000 | 0.033 | 0.028 | ||
| 11 spectra, ILSGVVTK | 0.046 | 0.000 | 0.055 | 0.800 | 0.000 | 0.000 | 0.099 | 0.000 | ||
| 11 spectra, NIGLGFK | 0.000 | 0.000 | 0.019 | 0.839 | 0.000 | 0.000 | 0.142 | 0.000 |
| Plot | Mito | Lyso or Perox | ER | Golgi | PM | Cytosol | Nucleus | ||||||
| Expt B |
8 peptides |
33 spectra |
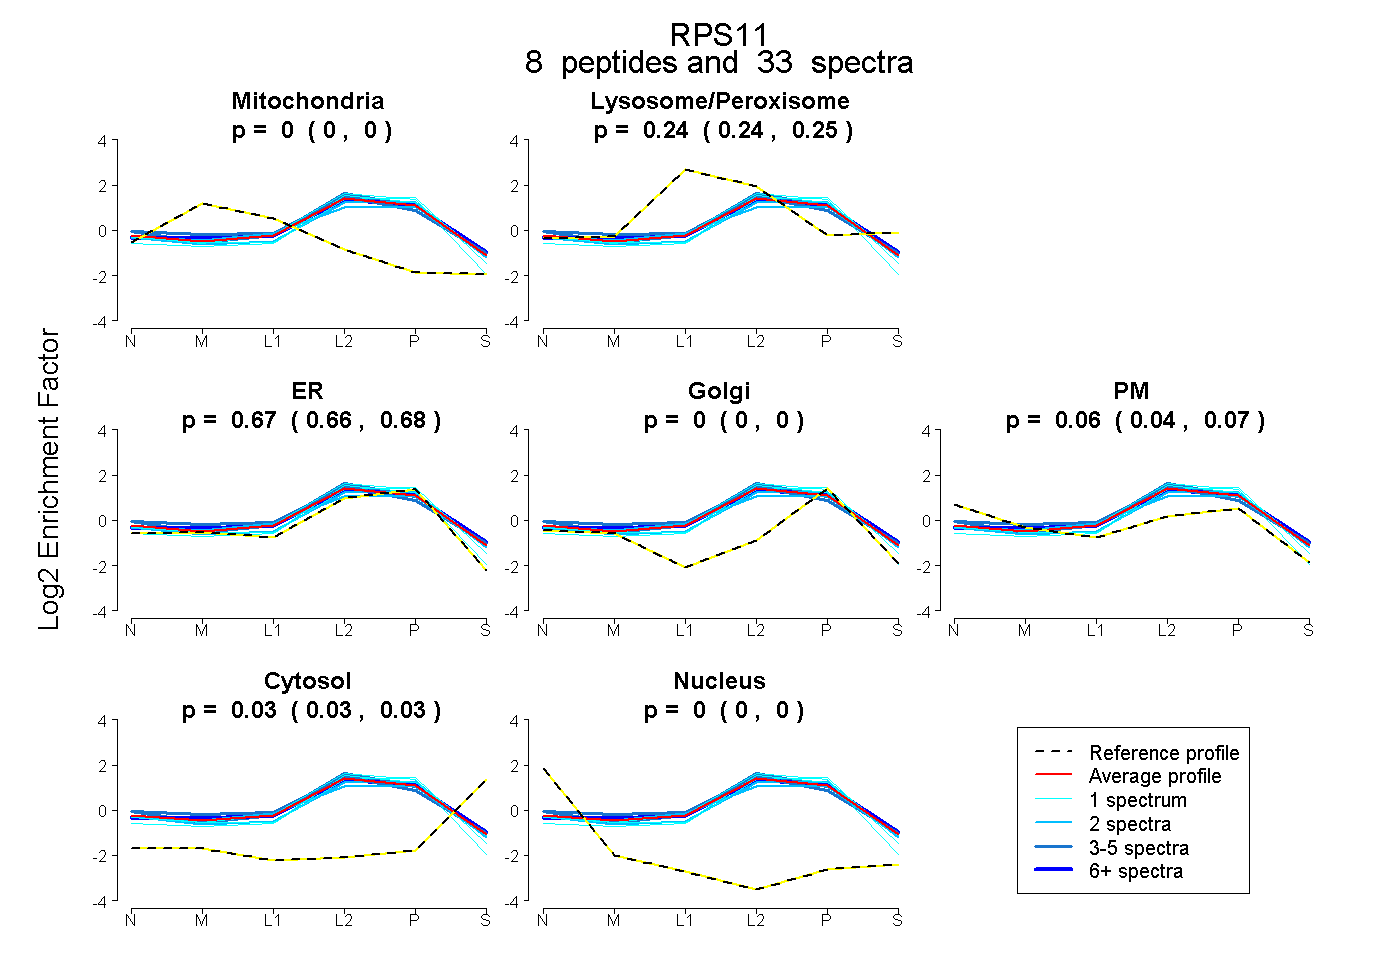 |
0.000 0.000 | 0.000 |
0.243 0.239 | 0.247 |
0.671 0.660 | 0.680 |
0.000 0.000 | 0.000 |
0.056 0.044 | 0.066 |
0.030 0.026 | 0.033 |
0.000 0.000 | 0.000 |
|||
| Plot | Lyso | Other | |||||||||||
| Expt C |
11 peptides |
152 spectra |
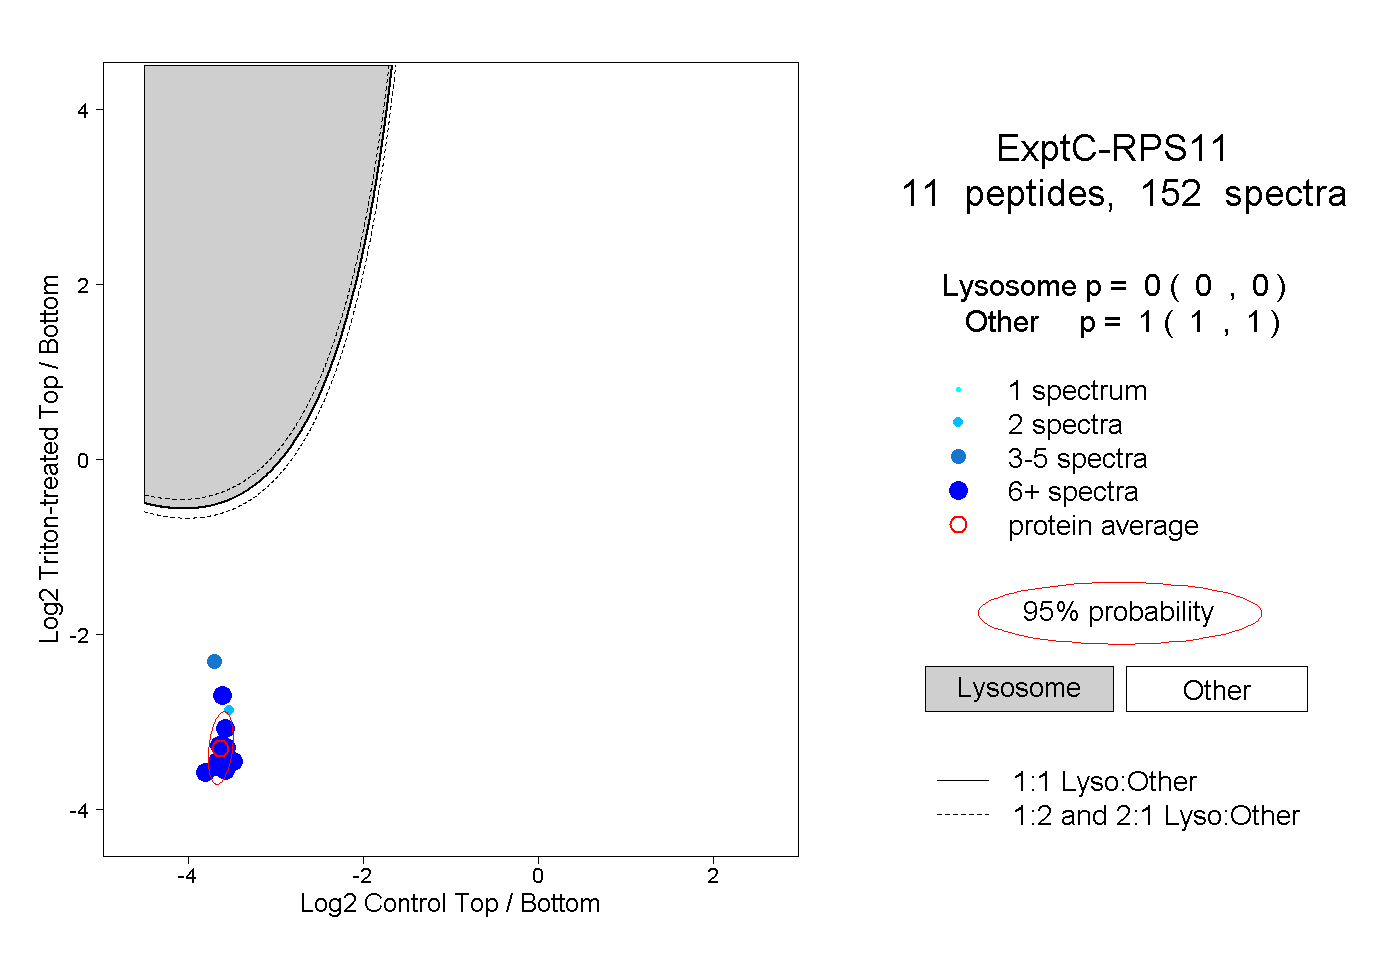 |
0.000 0.000 | 0.000 |
1.000 1.000 | 1.000 |
||||||||
| Plot | Lyso | Other | |||||||||||
| Expt D |
6 peptides |
27 spectra |
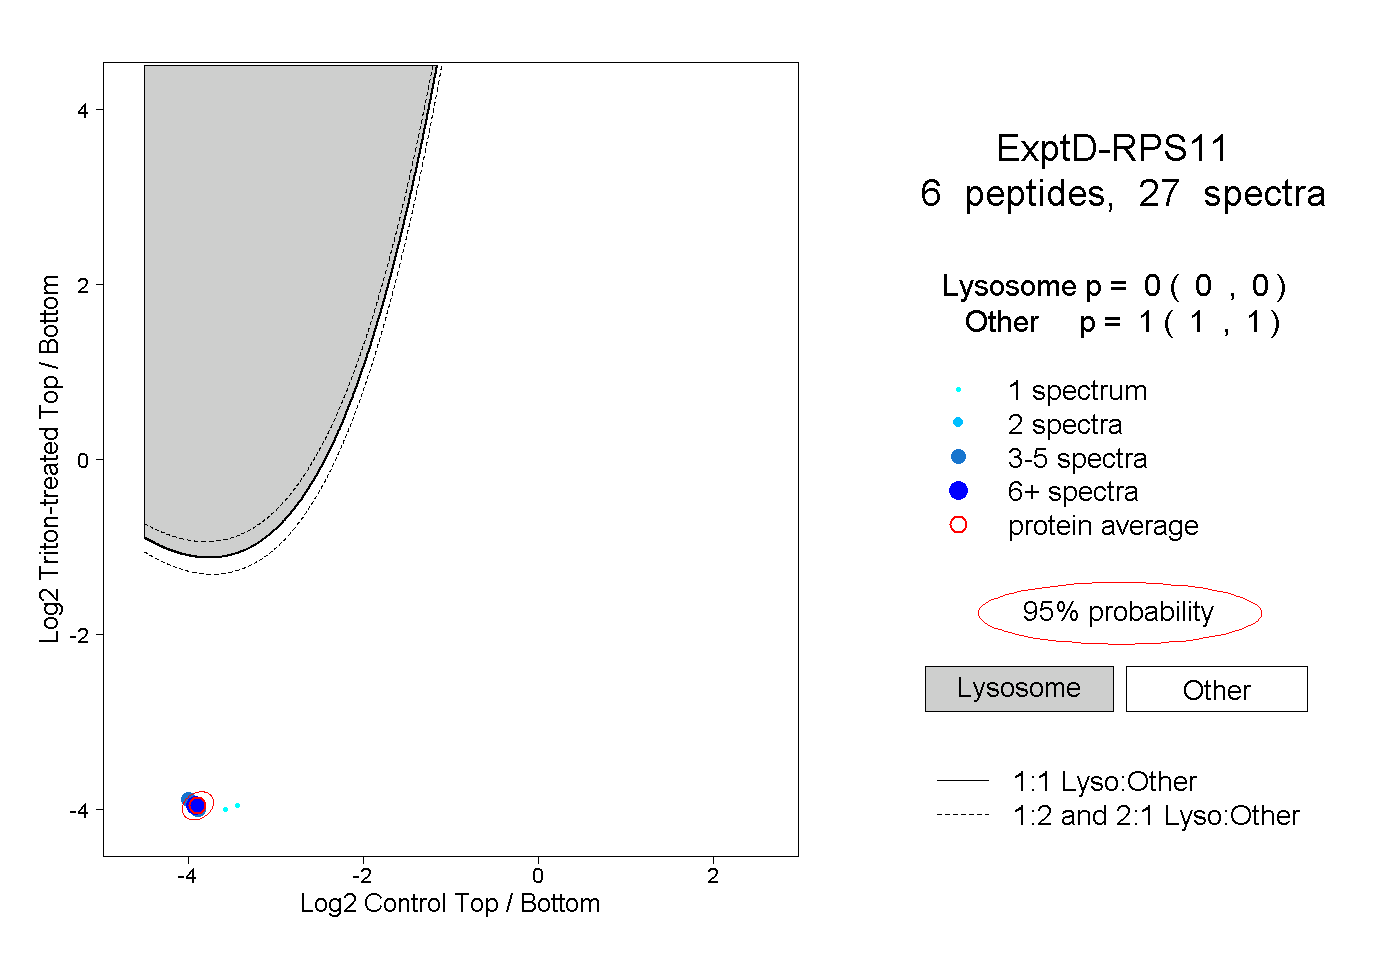 |
0.000 0.000 | 0.000 |
1.000 1.000 | 1.000 |