 6
6peptides
spectra
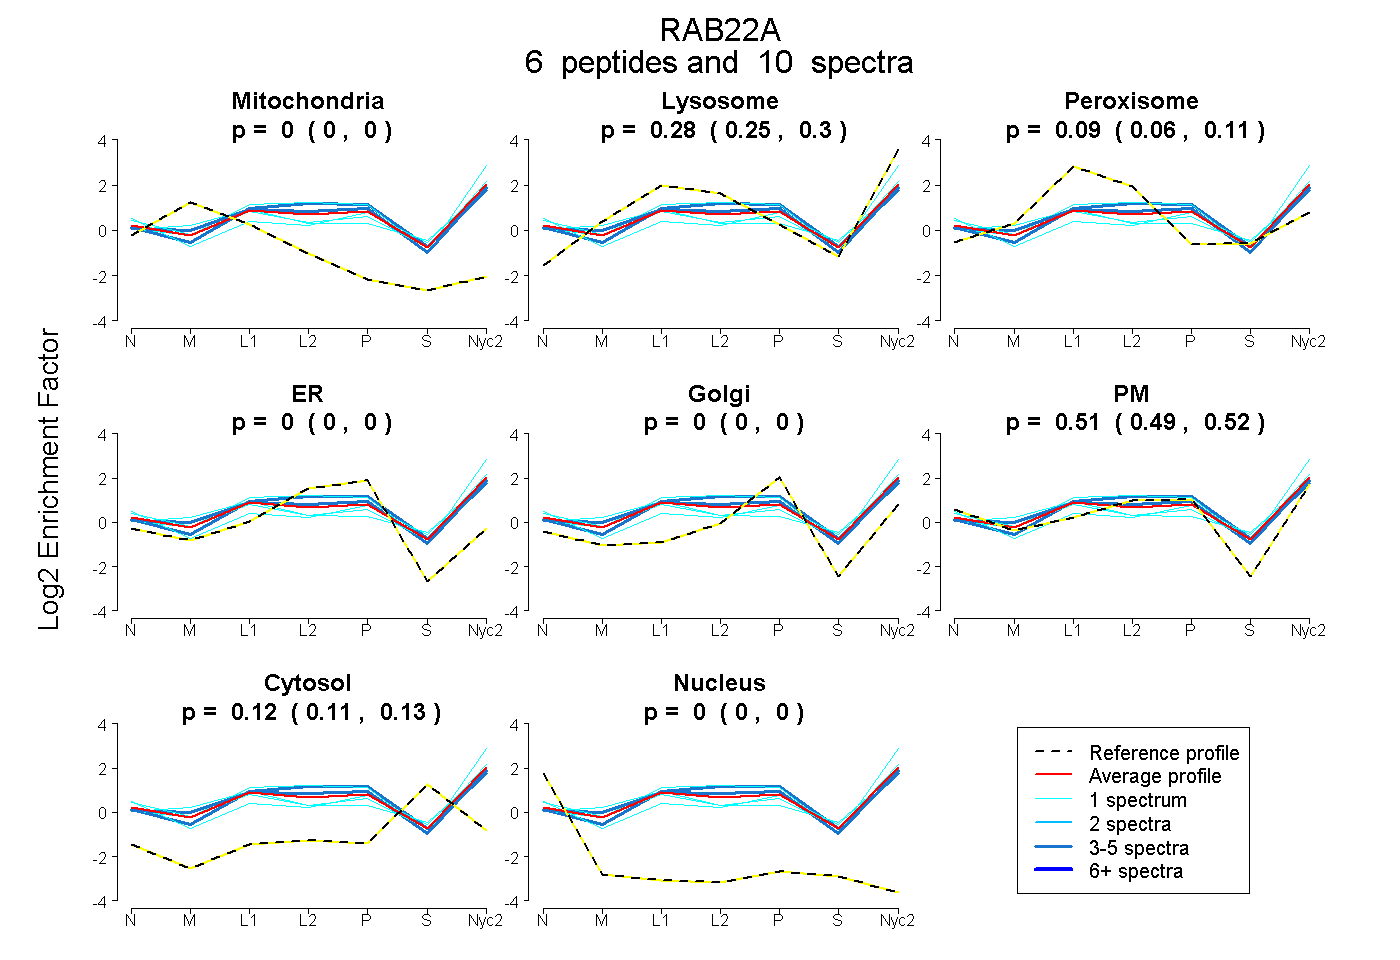
0.000 | 0.000
0.250 | 0.302
0.061 | 0.113
0.000 | 0.000
0.000 | 0.000
0.491 | 0.524
0.112 | 0.134
0.000 | 0.000
7peptides
spectra
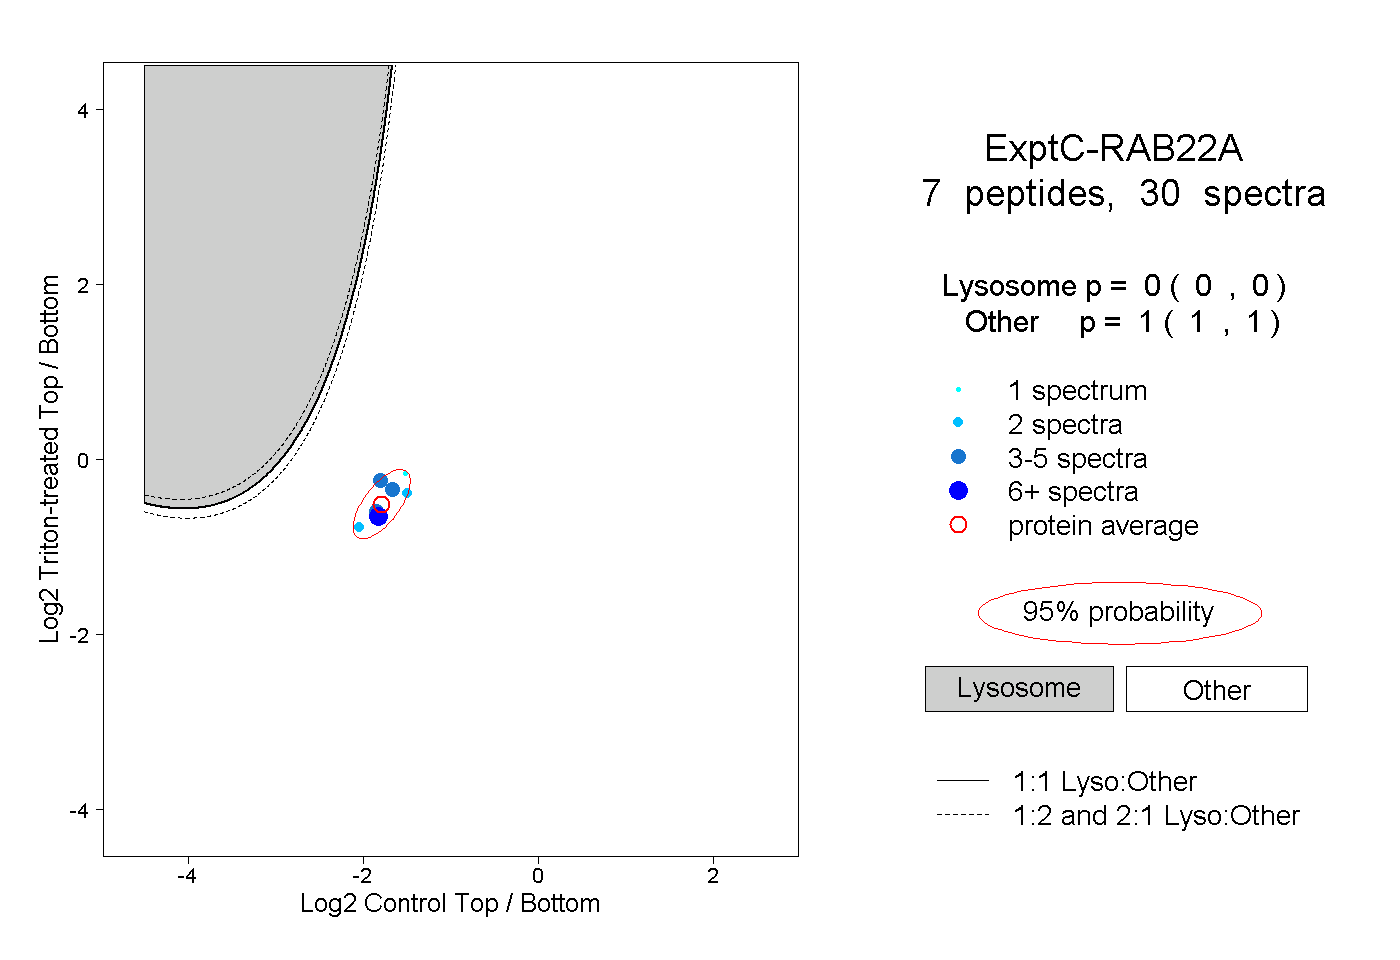
0.000 | 0.000
1.000 | 1.000
1peptide
spectrum
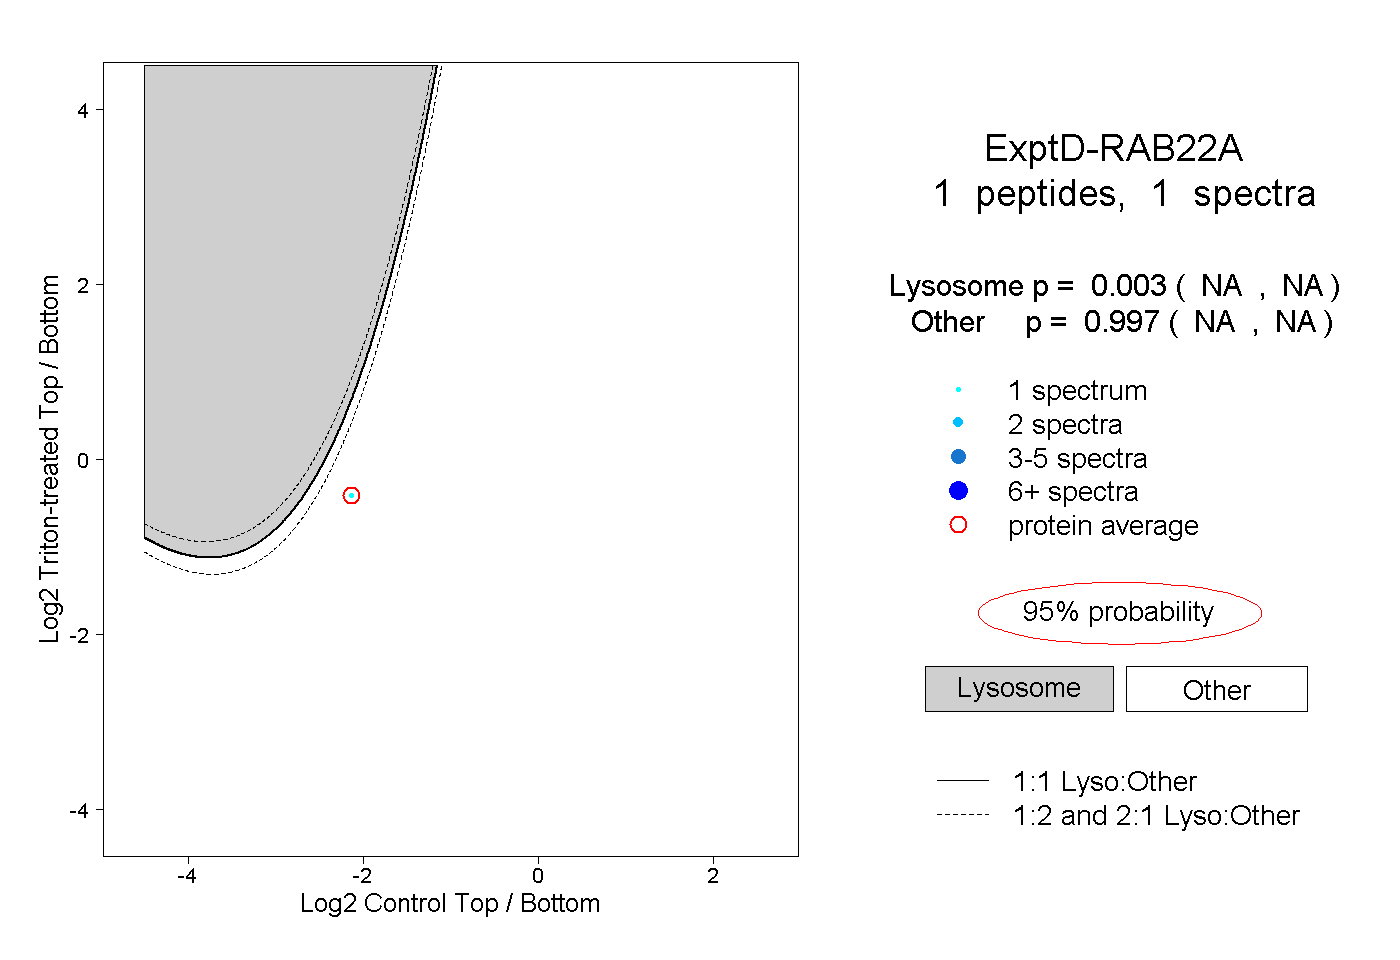
NA | NA
NA | NA