 4
4peptides
spectra
0.000 | 0.000
0.000 | 0.000
0.000 | 0.030
0.000 | 0.074
0.000 | 0.000
0.752 | 0.884
0.106 | 0.147
0.000 | 0.005
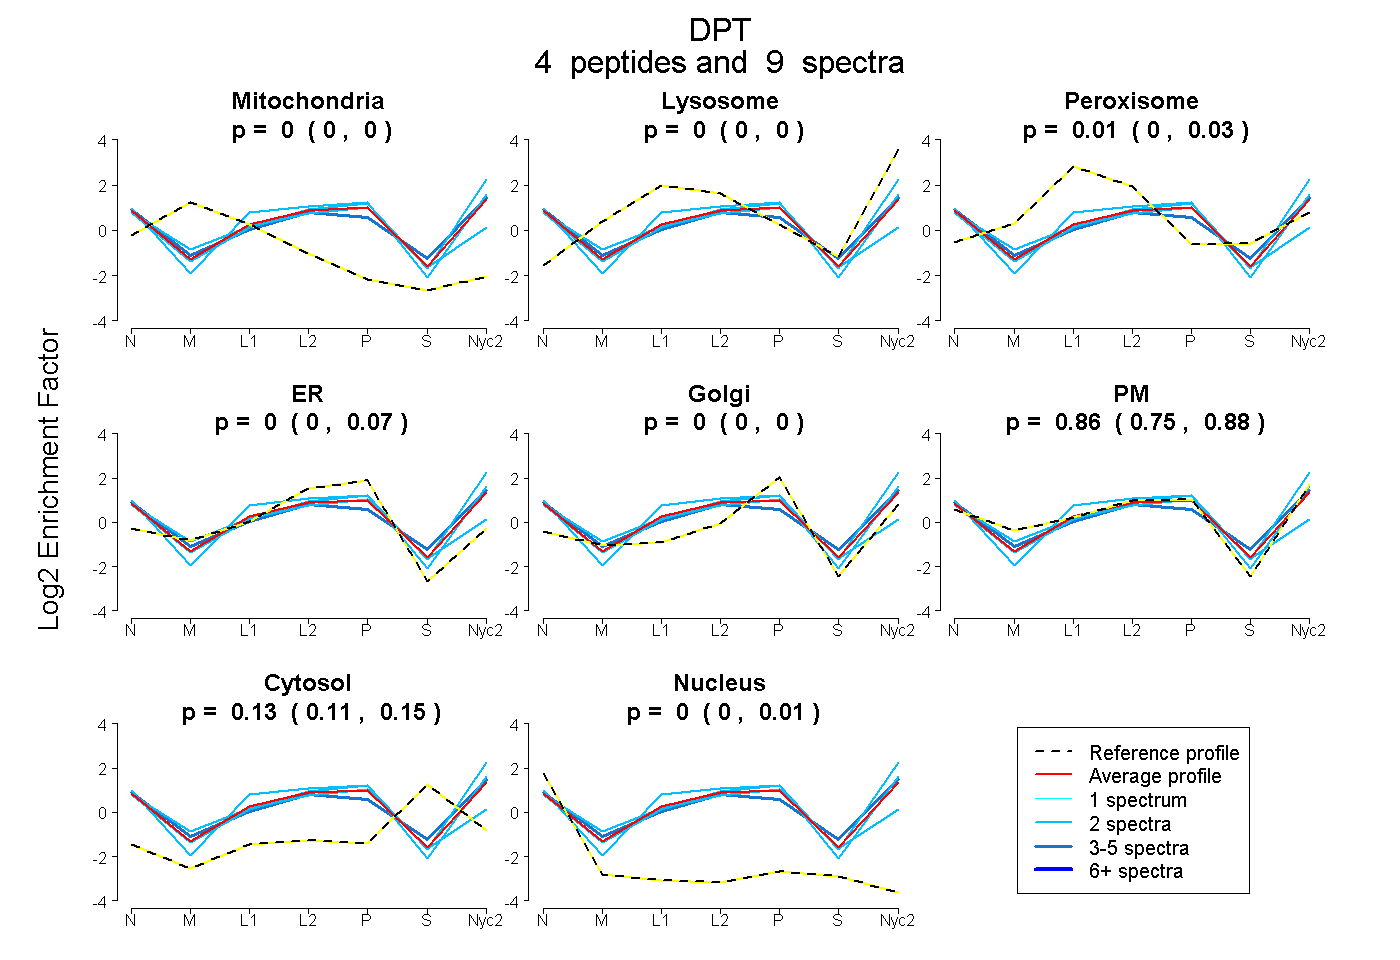
| Plot | Mito | Lyso | Perox | ER | Golgi | PM | Cytosol | Nucleus | |||||
| Expt A |
4 peptides |
9 spectra |
|
0.000 0.000 | 0.000 |
0.000 0.000 | 0.000 |
0.005 0.000 | 0.030 |
0.004 0.000 | 0.074 |
0.000 0.000 | 0.000 |
0.858 0.752 | 0.884 |
0.132 0.106 | 0.147 |
0.000 0.000 | 0.005 |
| 2 spectra, EWQFYCCR | 0.000 | 0.000 | 0.113 | 0.334 | 0.000 | 0.400 | 0.064 | 0.089 | ||
| 2 spectra, QGFSYQCPHGQVVVAVR | 0.000 | 0.000 | 0.011 | 0.056 | 0.000 | 0.878 | 0.056 | 0.000 | ||
| 2 spectra, YFESVLDR | 0.000 | 0.034 | 0.000 | 0.000 | 0.000 | 0.895 | 0.072 | 0.000 | ||
| 3 spectra, AGMEWYQK | 0.000 | 0.000 | 0.028 | 0.000 | 0.000 | 0.792 | 0.181 | 0.000 |
| Plot | Lyso | Other | |||||||||||
| Expt C |
4 peptides |
10 spectra |
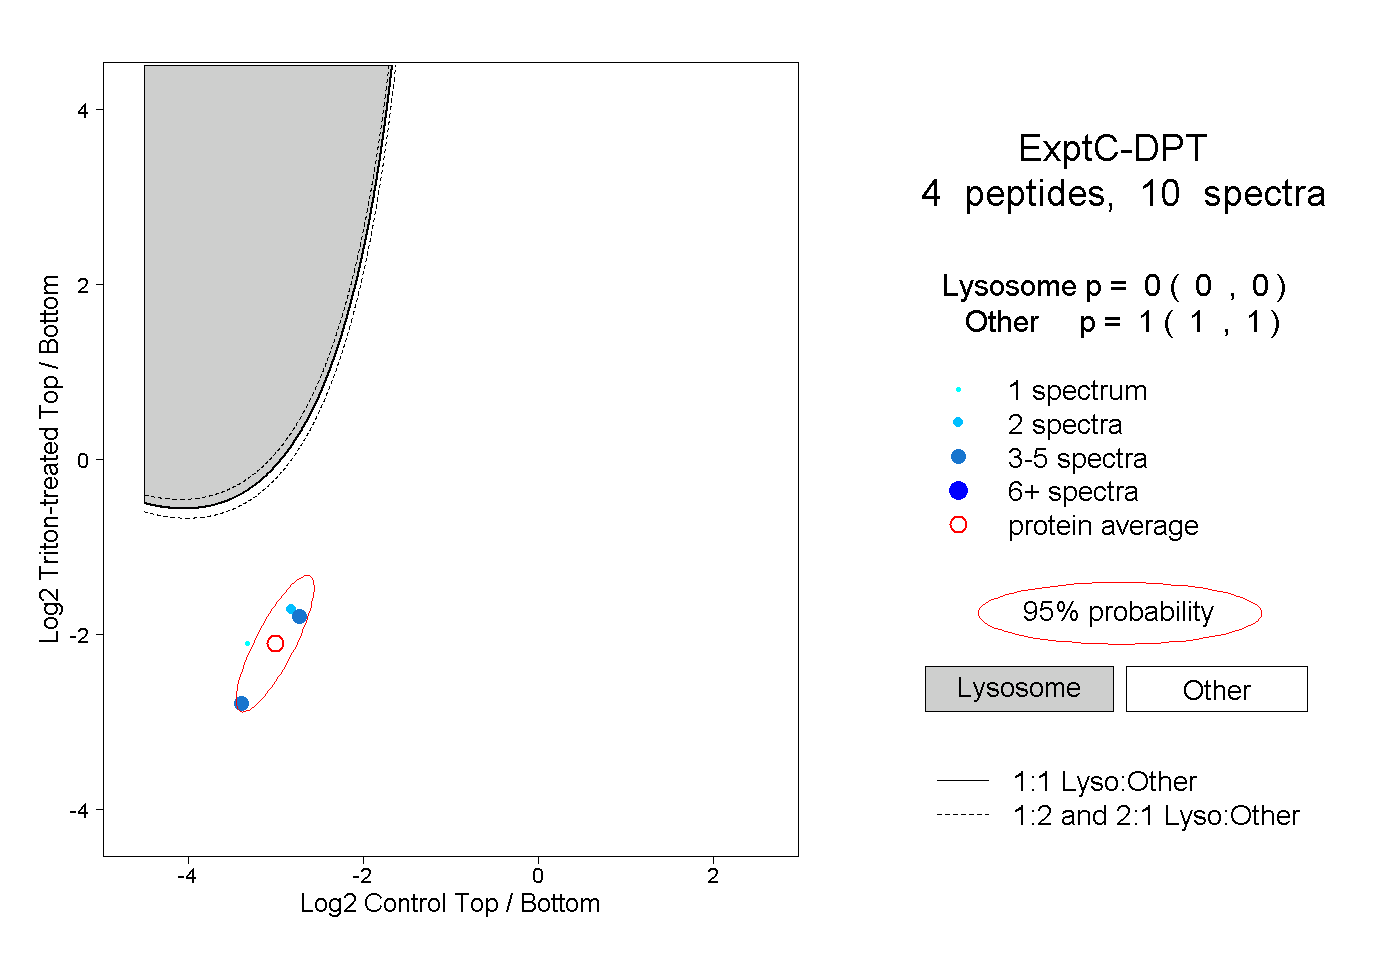 |
0.000 0.000 | 0.000 |
1.000 1.000 | 1.000 |
||||||||
| Plot | Lyso | Other | |||||||||||
| Expt D |
2 peptides |
2 spectra |
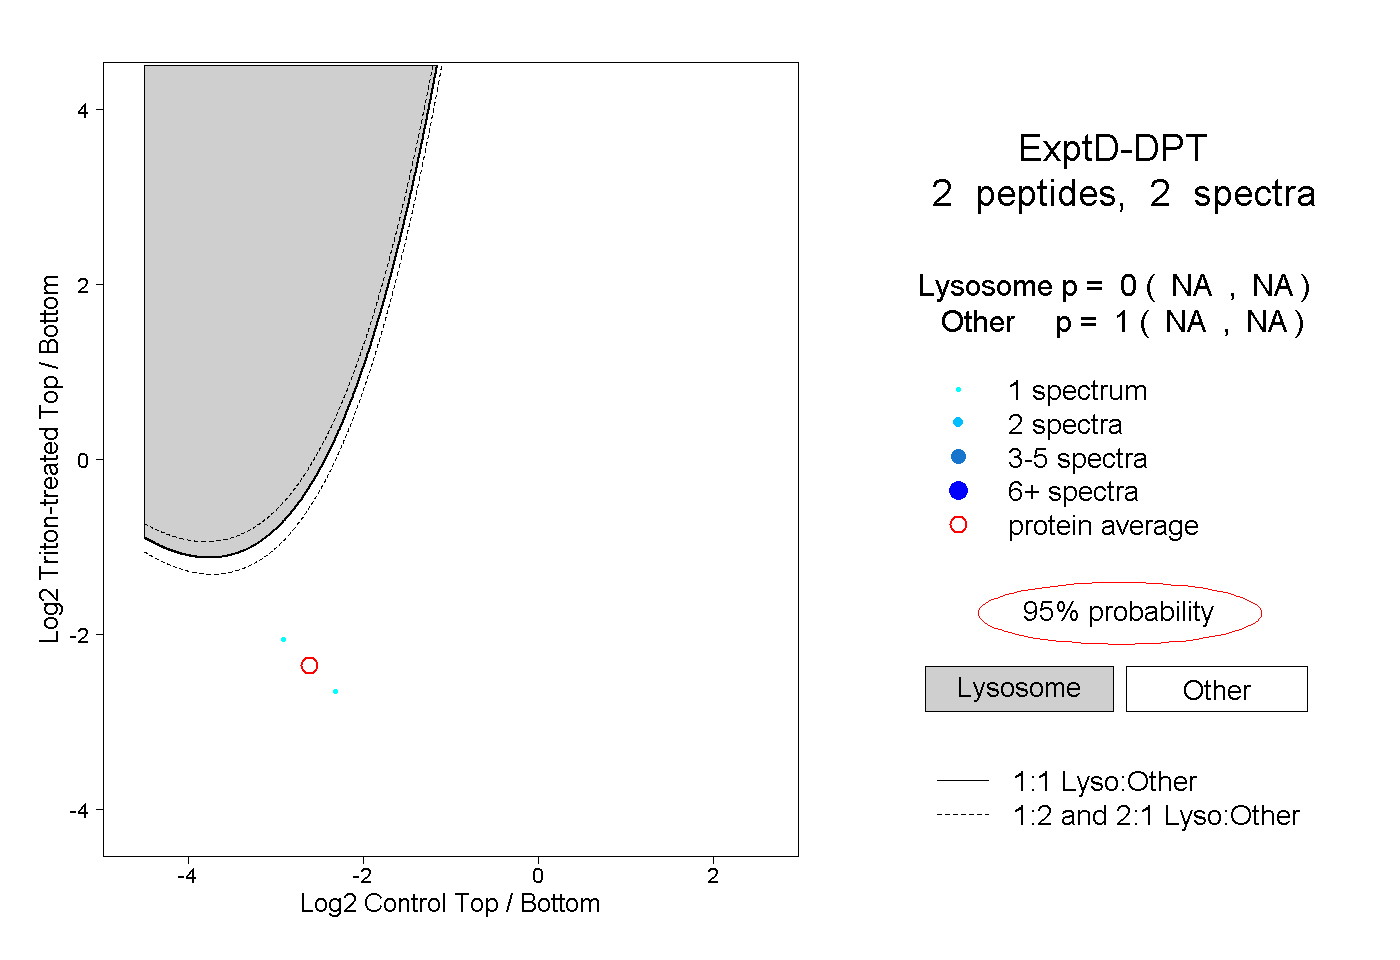 |
0.000 NA | NA |
1.000 NA | NA |