 2
2peptides
spectra
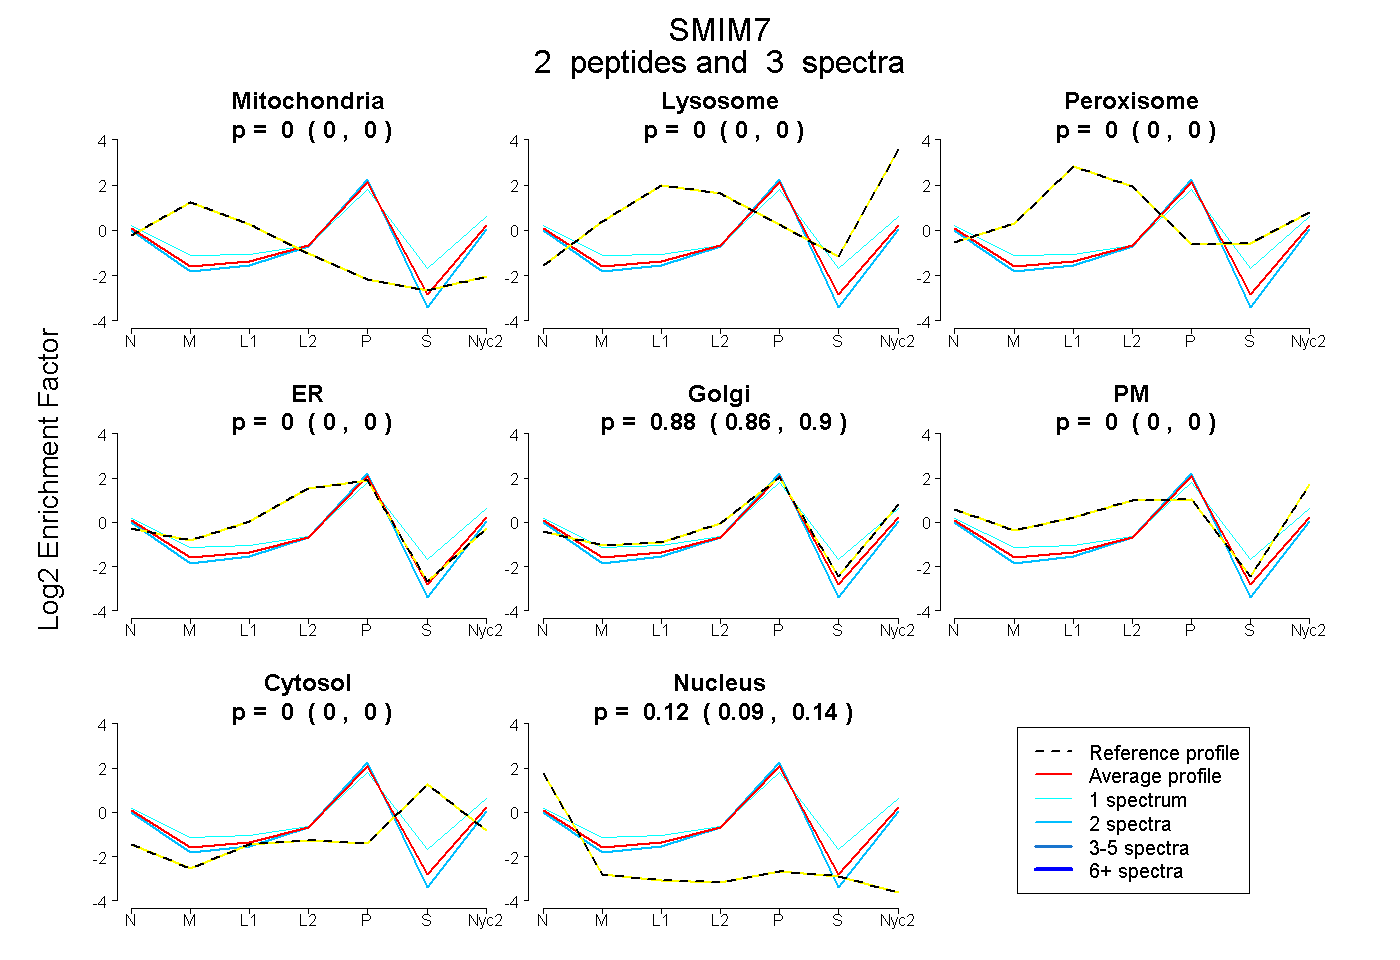
0.000 | 0.000
0.000 | 0.000
0.000 | 0.000
0.000 | 0.000
0.860 | 0.902
0.000 | 0.000
0.000 | 0.000
0.092 | 0.136
| Plot | Mito | Lyso | Perox | ER | Golgi | PM | Cytosol | Nucleus | |||||
| Expt A |
2 peptides |
3 spectra |
|
0.000 0.000 | 0.000 |
0.000 0.000 | 0.000 |
0.000 0.000 | 0.000 |
0.000 0.000 | 0.000 |
0.883 0.860 | 0.902 |
0.000 0.000 | 0.000 |
0.000 0.000 | 0.000 |
0.117 0.092 | 0.136 |
| 2 spectra, DTQGFGEESR | 0.000 | 0.000 | 0.000 | 0.000 | 0.864 | 0.000 | 0.000 | 0.136 | ||
| 1 spectrum, EPSTGDNIR | 0.000 | 0.000 | 0.000 | 0.000 | 0.840 | 0.026 | 0.092 | 0.042 |
| Plot | Lyso | Other | |||||||||||
| Expt C |
2 peptides |
4 spectra |
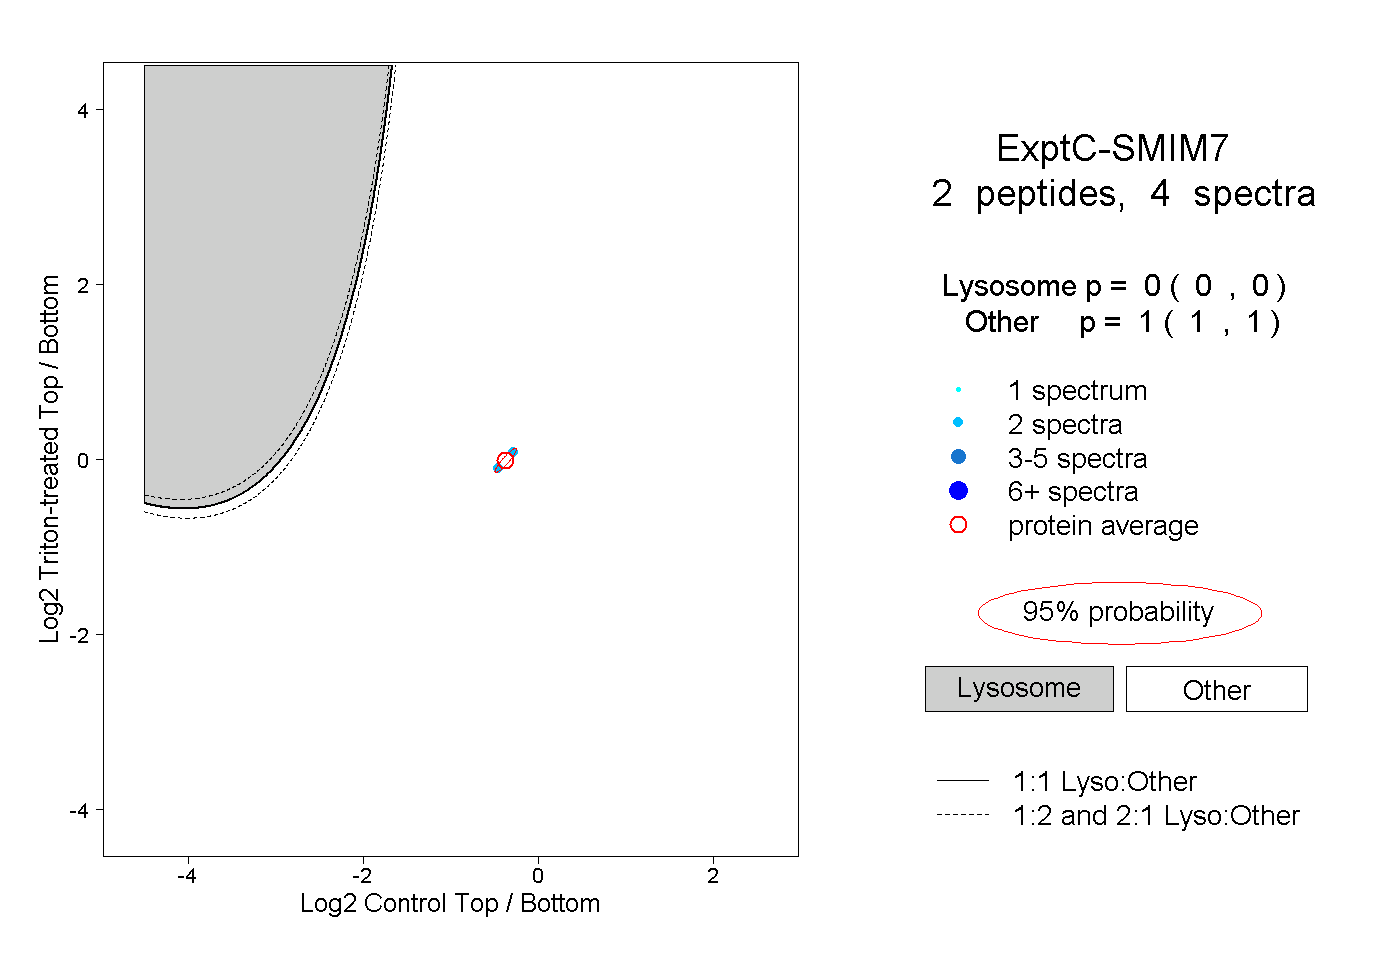 |
0.000 0.000 | 0.000 |
1.000 1.000 | 1.000 |