 3
3peptides
spectra
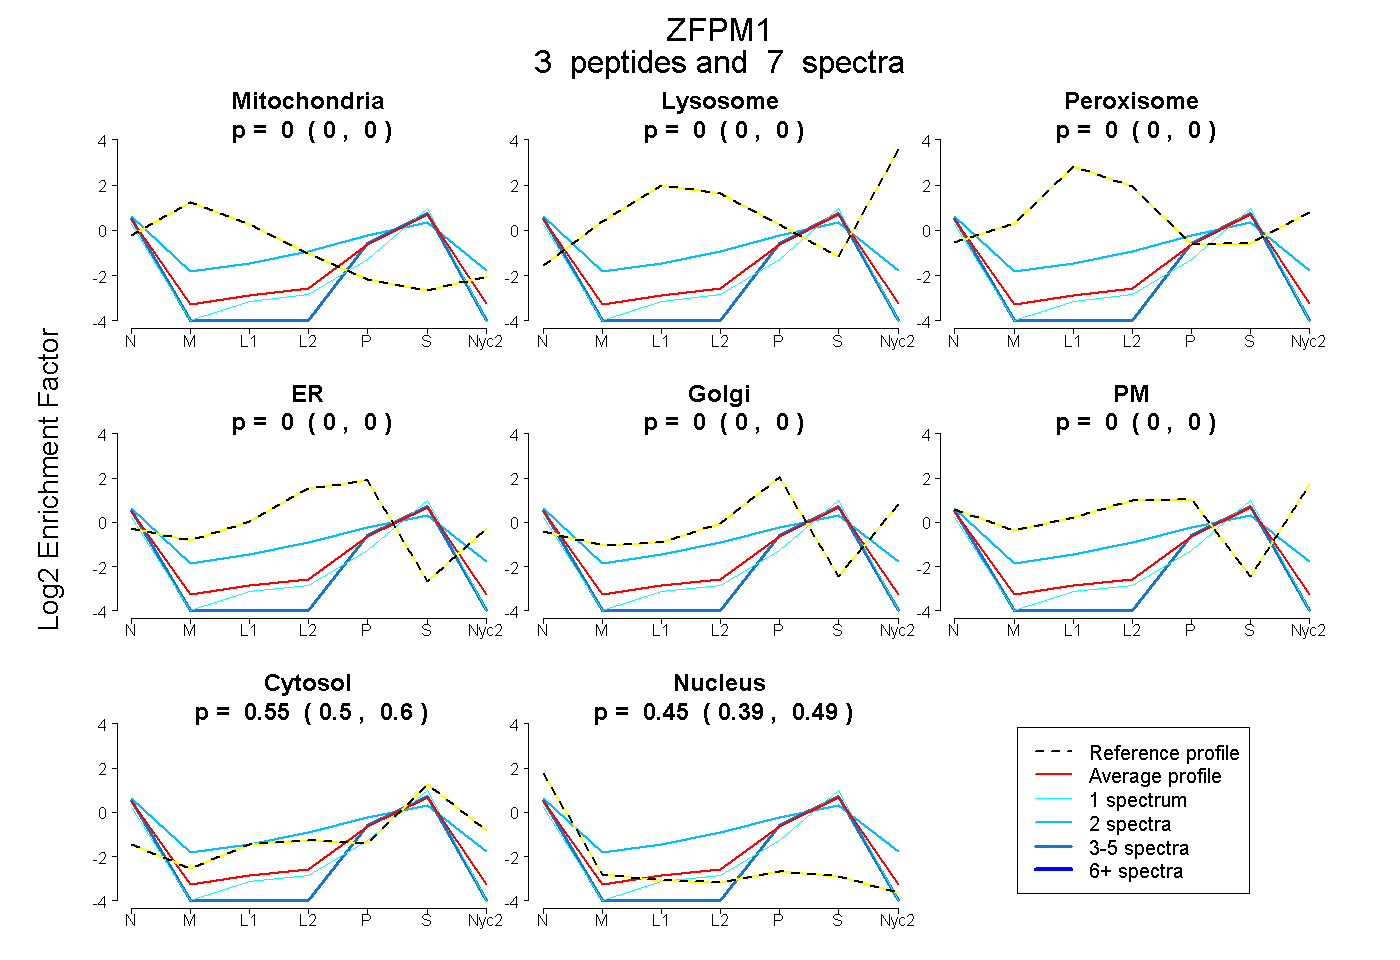
0.000 | 0.000
0.000 | 0.000
0.000 | 0.000
0.000 | 0.000
0.000 | 0.000
0.000 | 0.000
0.500 | 0.598
0.391 | 0.491
| Plot | Mito | Lyso | Perox | ER | Golgi | PM | Cytosol | Nucleus | |||||
| Expt A |
3 peptides |
7 spectra |
|
0.000 0.000 | 0.000 |
0.000 0.000 | 0.000 |
0.000 0.000 | 0.000 |
0.000 0.000 | 0.000 |
0.000 0.000 | 0.000 |
0.000 0.000 | 0.000 |
0.551 0.500 | 0.598 |
0.449 0.391 | 0.491 |
| 1 spectrum, VEAAEEPEAAR | 0.000 | 0.000 | 0.000 | 0.000 | 0.000 | 0.000 | 0.507 | 0.493 | ||
| 4 spectra, RPPVPTPAPGPAAPALTAPPVR | 0.000 | 0.000 | 0.000 | 0.000 | 0.000 | 0.000 | 0.398 | 0.602 | ||
| 2 spectra, GPPAPAPAPGGGGGHR | 0.000 | 0.000 | 0.000 | 0.250 | 0.000 | 0.000 | 0.537 | 0.213 |
| Plot | Lyso | Other | |||||||||||
| Expt C |
1 peptide |
1 spectrum |
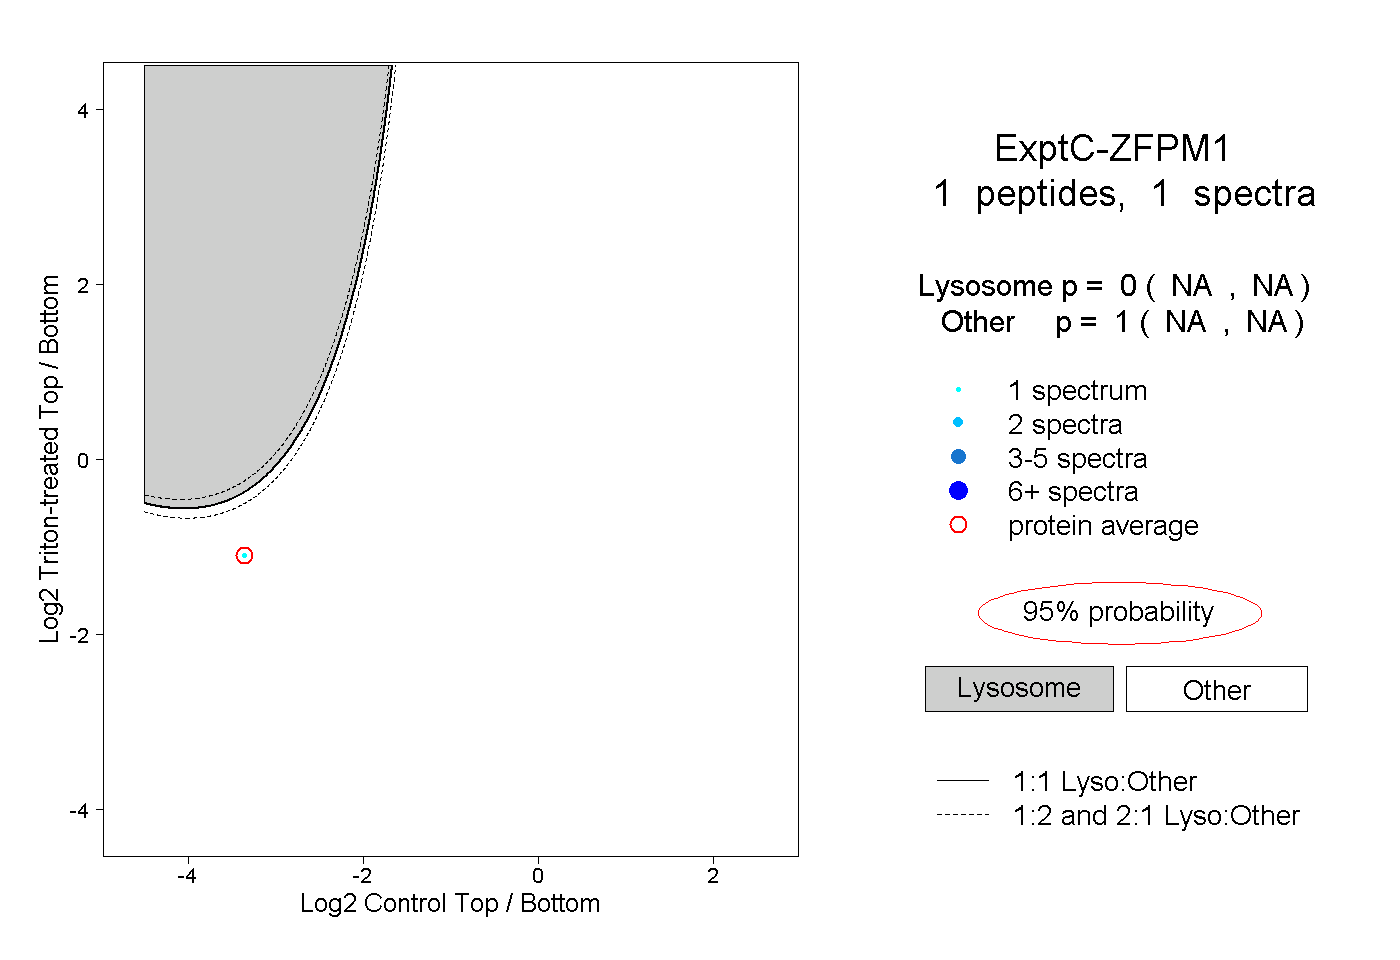 |
0.000 NA | NA |
1.000 NA | NA |