VTA1
[ENSRNOP00000061074]
Main page
| | | Plot |
Mito |
Lyso |
|
Perox |
ER |
Golgi |
PM |
Cytosol |
Nucleus |
|
| Expt A |
 4
4
peptides |
9
spectra |
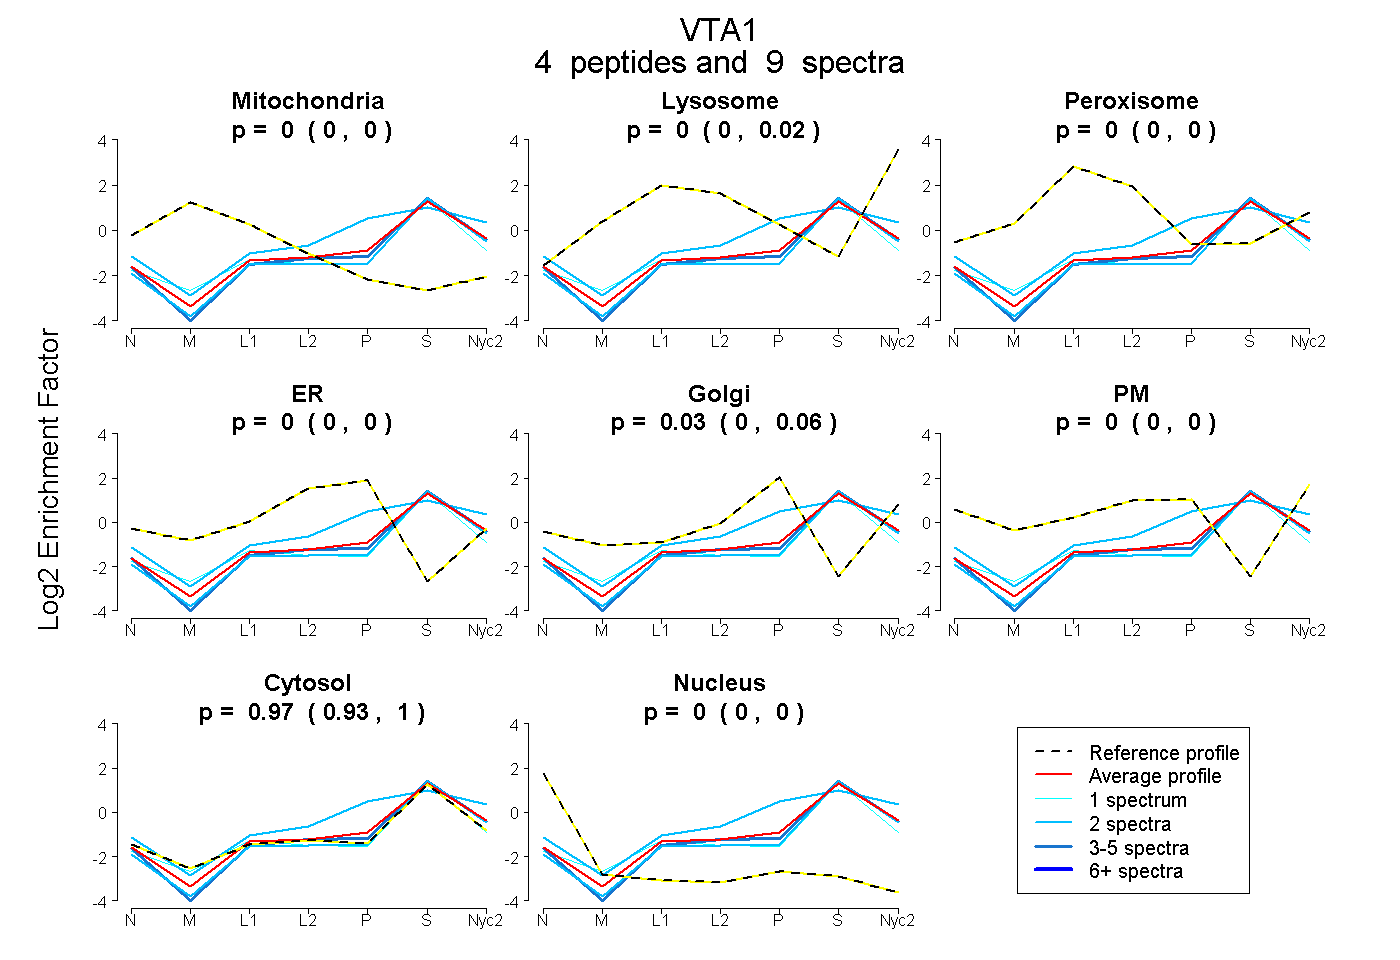 |
0.000
0.000 | 0.000 |
0.000
0.000 | 0.022 |
|
0.000
0.000 | 0.000 |
0.000
0.000 | 0.000 |
0.031
0.000 | 0.059 |
0.000
0.000 | 0.000 |
0.969
0.933 | 0.996 |
0.000
0.000 | 0.000 |
|
| | | Plot |
Mito |
|
Lyso or Perox |
|
ER |
Golgi |
PM |
Cytosol |
Nucleus |
|
| Expt B |
1
peptide |
2
spectra |
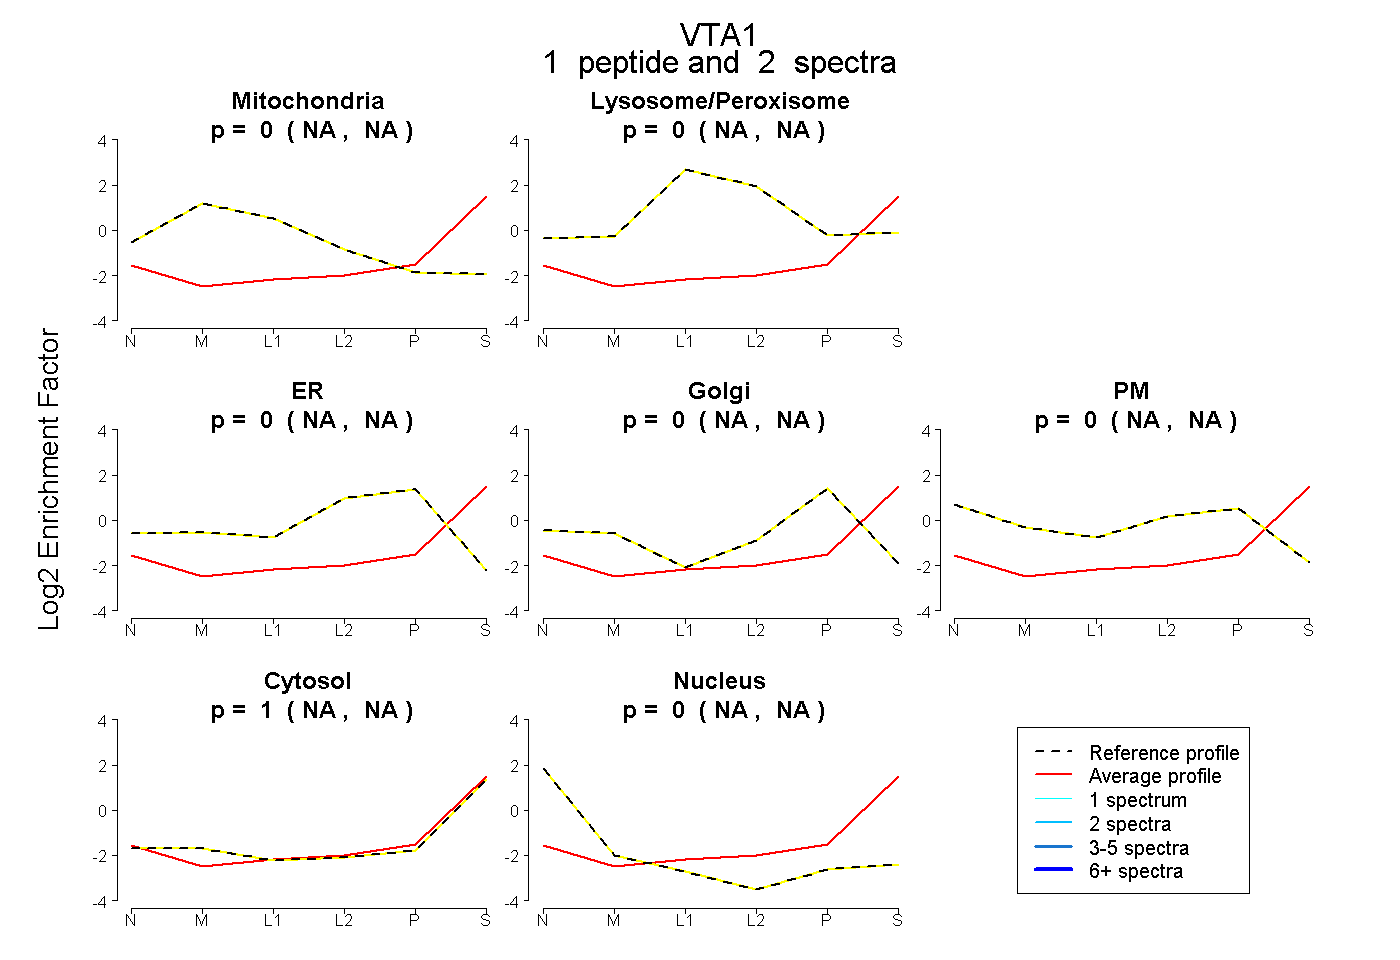 |
0.000
NA | NA |
|
0.000
NA | NA |
|
0.000
NA | NA |
0.000
NA | NA |
0.000
NA | NA |
1.000
NA | NA |
0.000
NA | NA |
|
| | | Plot |
|
Lyso |
|
|
|
|
|
|
|
Other |
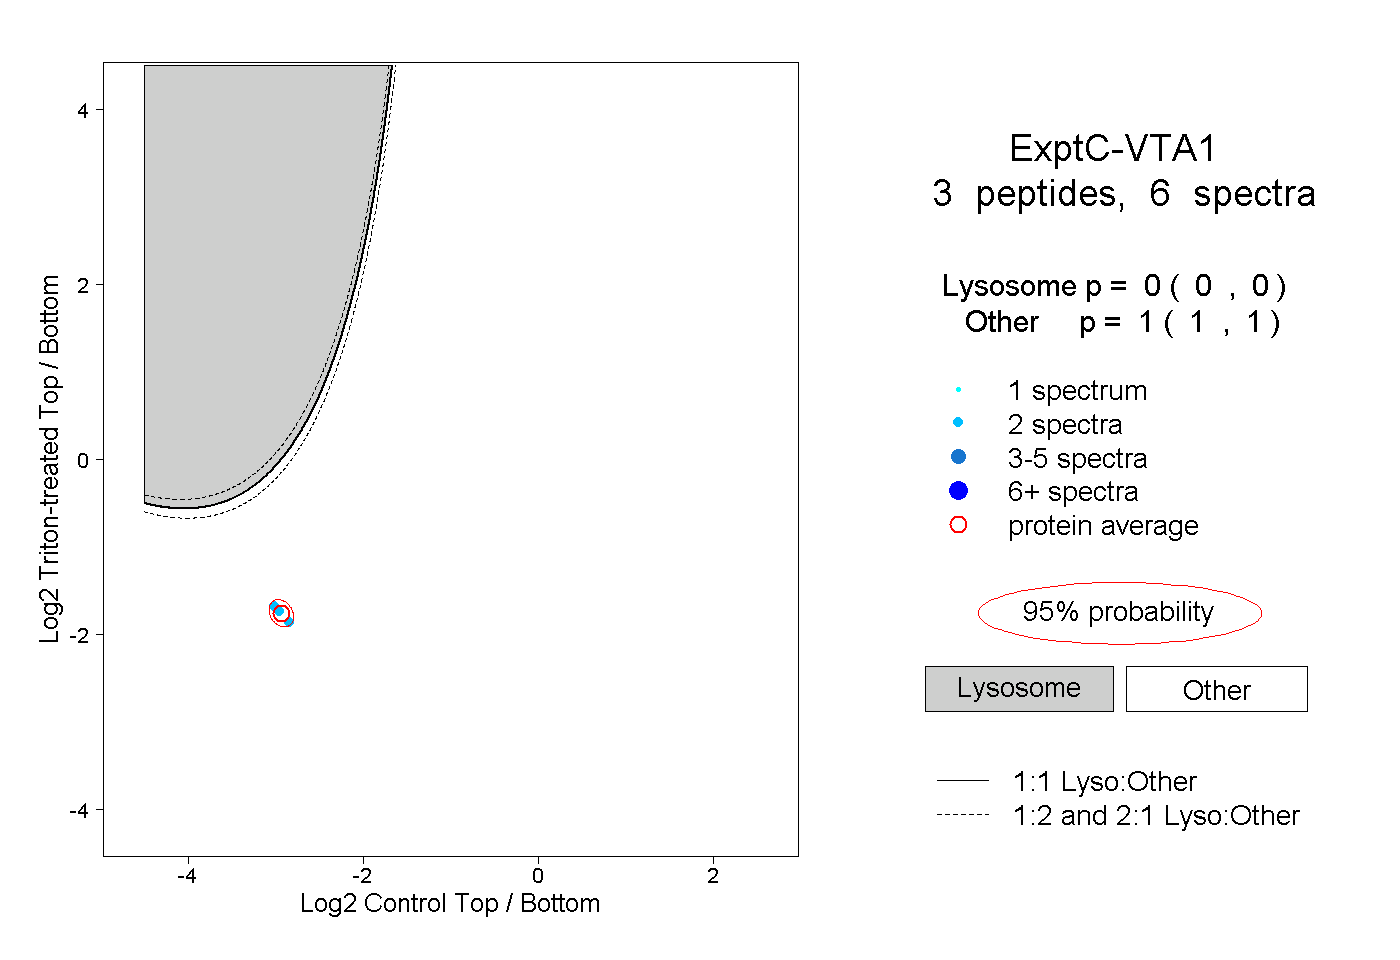
| Expt C |
3
peptides |
6
spectra |
 |
|
0.000
0.000 | 0.000 |
|
|
|
|
|
|
|
1.000
1.000 | 1.000 |
| 2 spectra, ATYIHNCLK |
|
0.000 |
|
|
|
|
|
|
|
1.000 |
| 2 spectra, MFLYADNEDR |
|
0.000 |
|
|
|
|
|
|
|
1.000 |
| 2 spectra, LTPEDFAR |
|
0.000 |
|
|
|
|
|
|
|
1.000 |
| | | Plot |
|
Lyso |
|
|
|
|
|
|
|
Other |
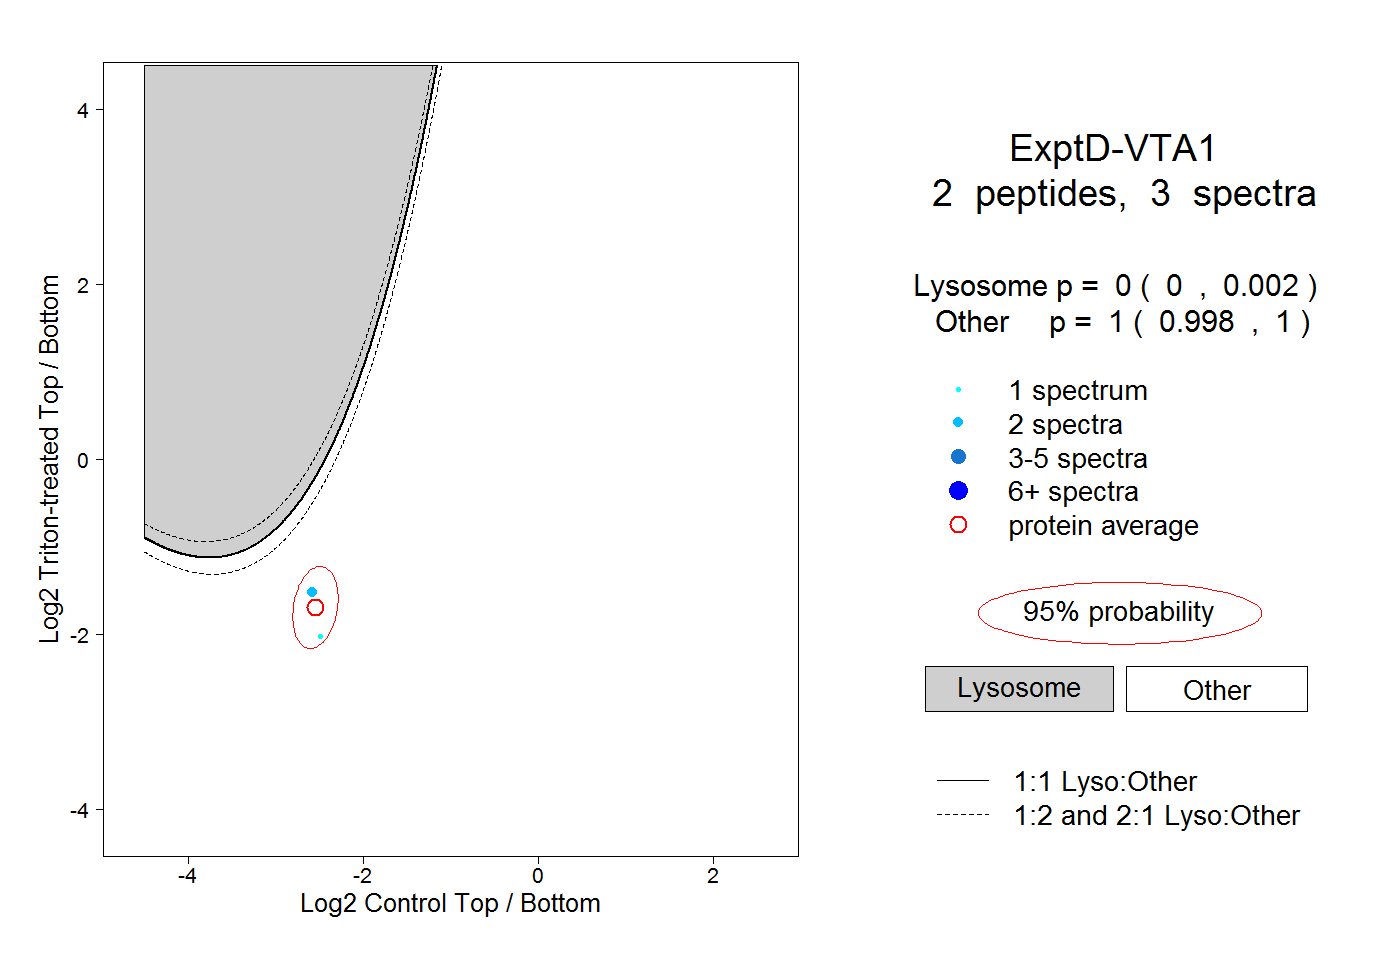
| Expt D |
2
peptides |
3
spectra |
 |
|
0.000
0.000 | 0.002 |
|
|
|
|
|
|
|
1.000
0.998 | 1.000 |