 7
7peptides
spectra
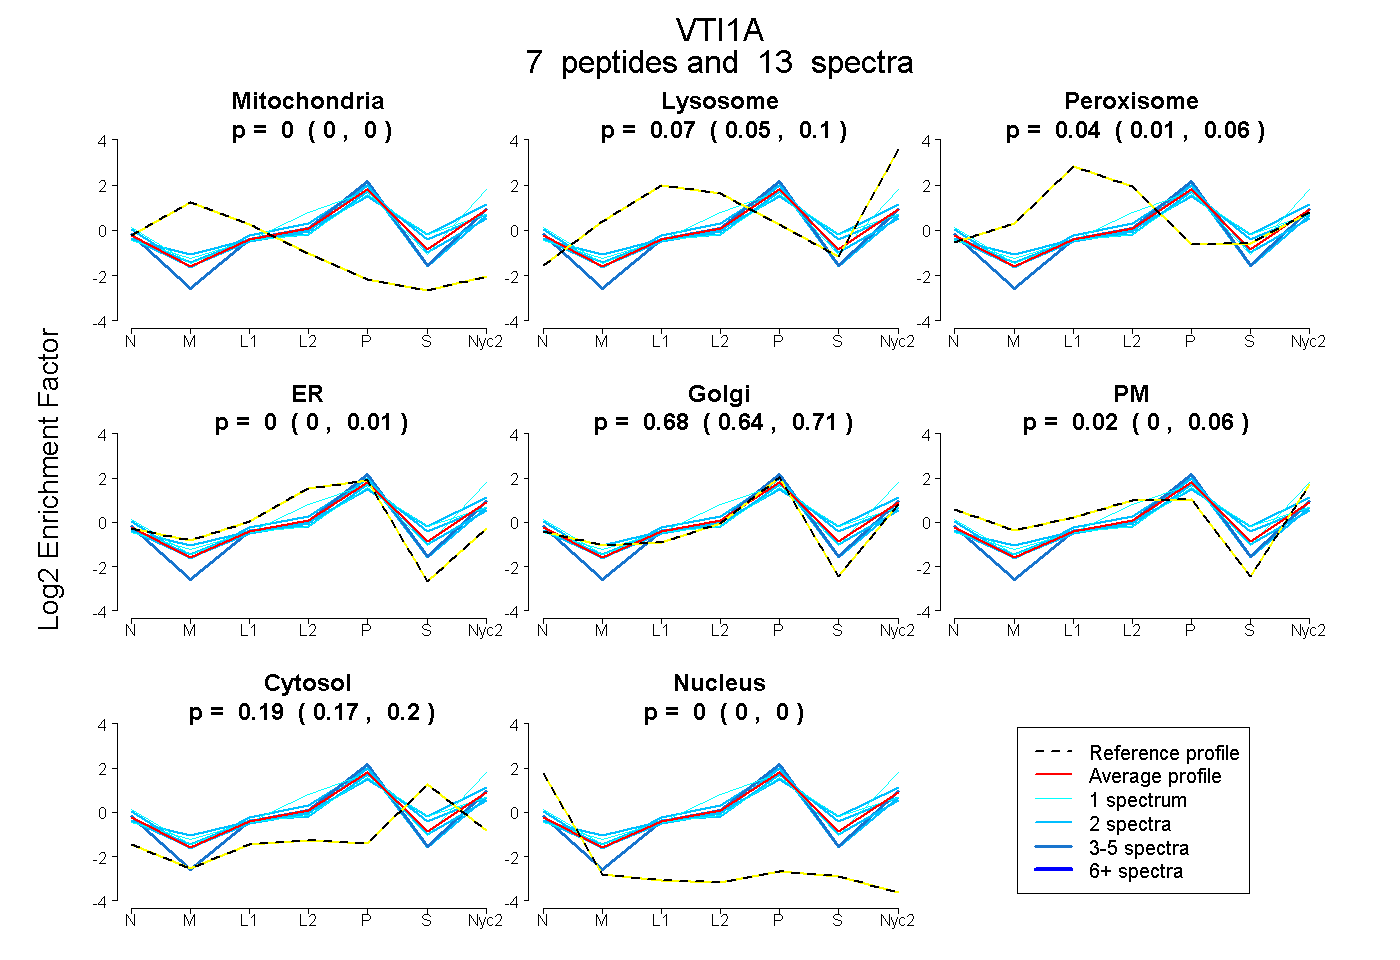
0.000 | 0.000
0.047 | 0.096
0.009 | 0.062
0.000 | 0.008
0.637 | 0.707
0.000 | 0.055
0.168 | 0.200
0.000 | 0.000
1peptide
spectra
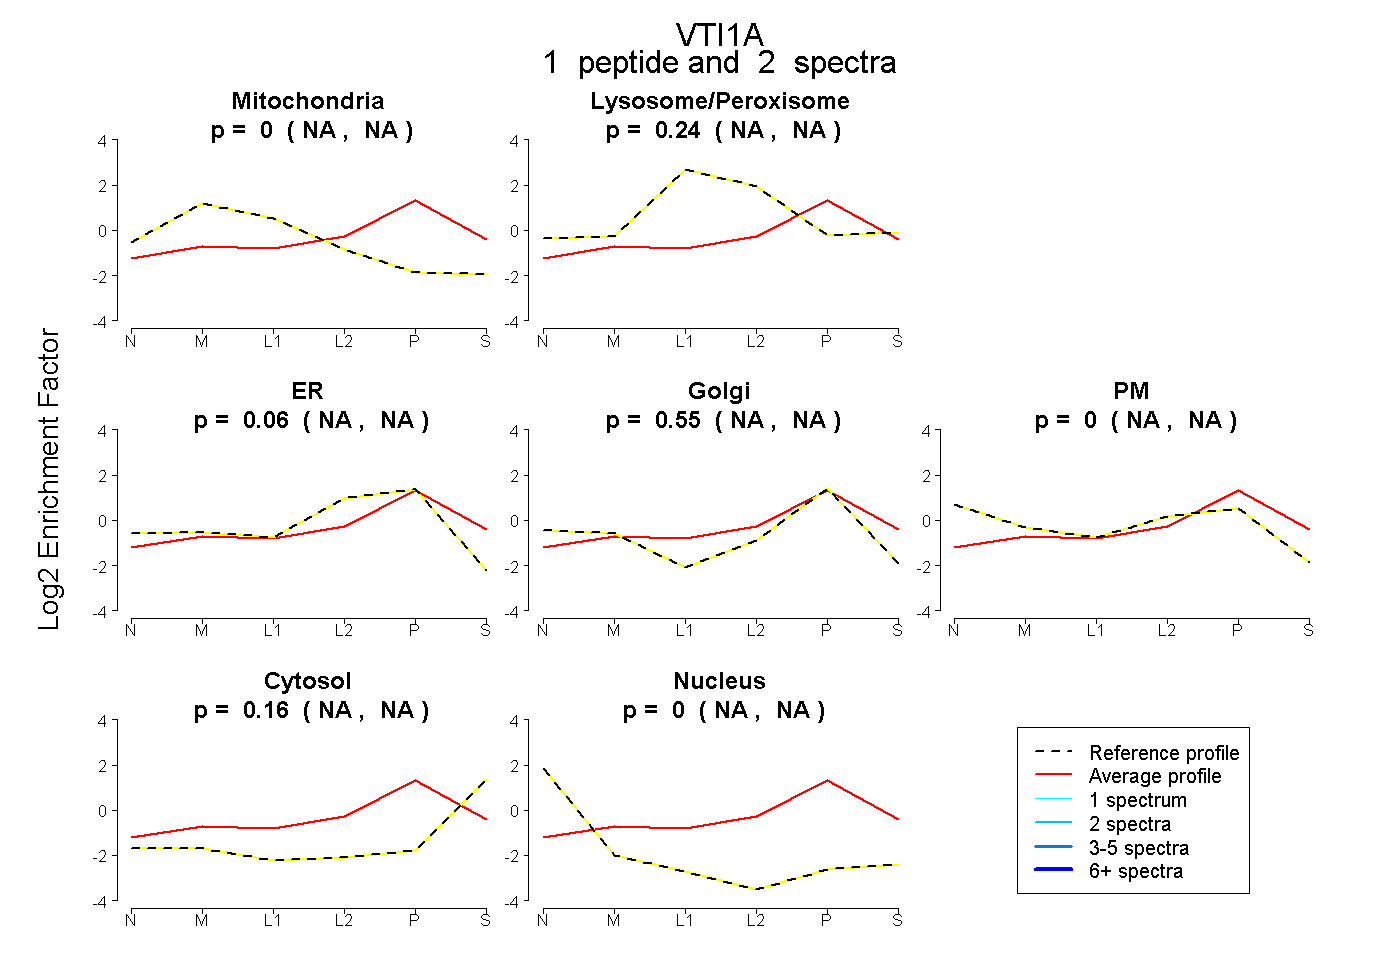
NA | NA
NA | NA
NA | NA
NA | NA
NA | NA
NA | NA
NA | NA
5peptides
spectra
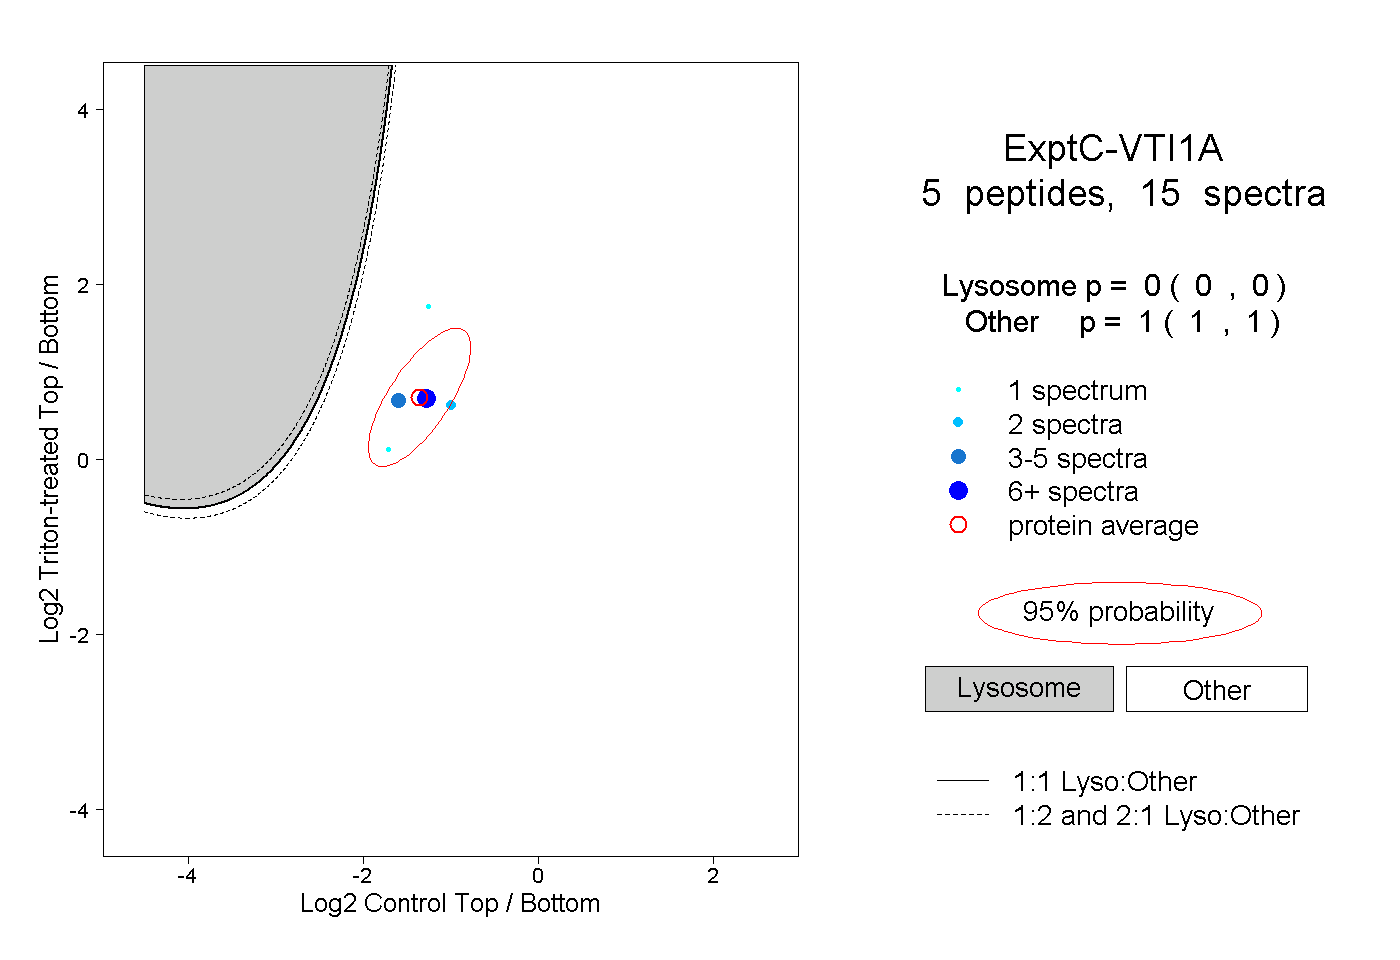
0.000 | 0.000
1.000 | 1.000