 6
6peptides
spectra
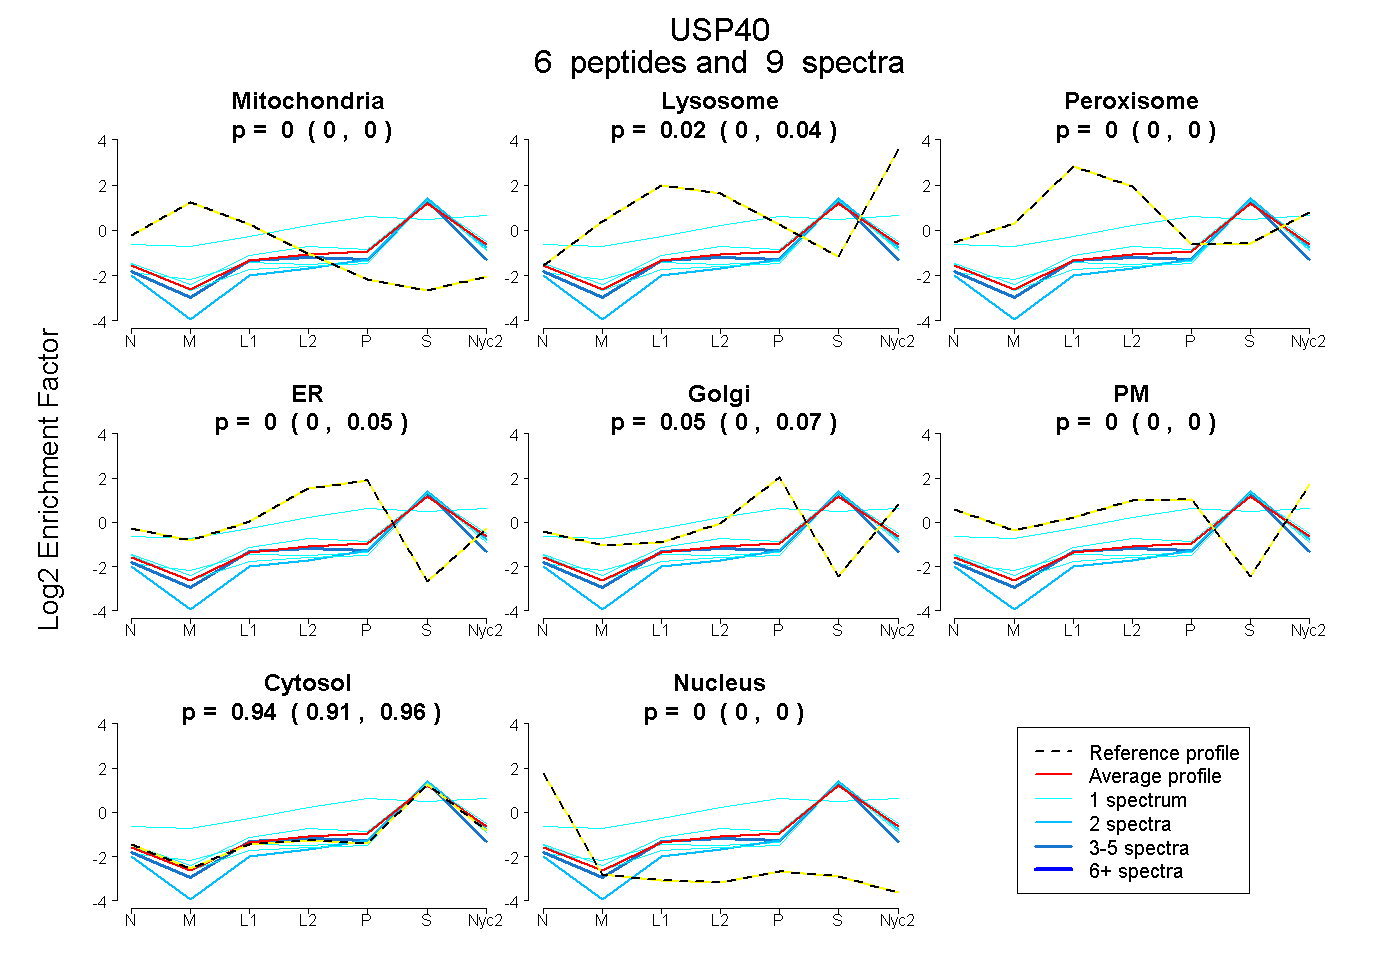
0.000 | 0.000
0.000 | 0.042
0.000 | 0.000
0.000 | 0.051
0.000 | 0.075
0.000 | 0.000
0.907 | 0.960
0.000 | 0.000
| Plot | Mito | Lyso | Perox | ER | Golgi | PM | Cytosol | Nucleus | |||||
| Expt A |
6 peptides |
9 spectra |
|
0.000 0.000 | 0.000 |
0.015 0.000 | 0.042 |
0.000 0.000 | 0.000 |
0.000 0.000 | 0.051 |
0.048 0.000 | 0.075 |
0.000 0.000 | 0.000 |
0.937 0.907 | 0.960 |
0.000 0.000 | 0.000 |
| 1 spectrum, LAVQSTSLLR | 0.000 | 0.000 | 0.000 | 0.000 | 0.000 | 0.000 | 0.983 | 0.017 | ||
| 1 spectrum, EEDLGPR | 0.000 | 0.073 | 0.000 | 0.039 | 0.000 | 0.000 | 0.887 | 0.000 | ||
| 1 spectrum, ATLQRPSEAQANPR | 0.000 | 0.161 | 0.164 | 0.000 | 0.278 | 0.000 | 0.397 | 0.000 | ||
| 2 spectra, IIPLQLQR | 0.000 | 0.000 | 0.000 | 0.000 | 0.000 | 0.000 | 1.000 | 0.000 | ||
| 1 spectrum, EMDAANVLLQTR | 0.015 | 0.000 | 0.000 | 0.000 | 0.000 | 0.000 | 0.985 | 0.000 | ||
| 3 spectra, FNFDFVK | 0.000 | 0.000 | 0.000 | 0.000 | 0.000 | 0.000 | 1.000 | 0.000 |
| Plot | Lyso | Other | |||||||||||
| Expt C |
2 peptides |
5 spectra |
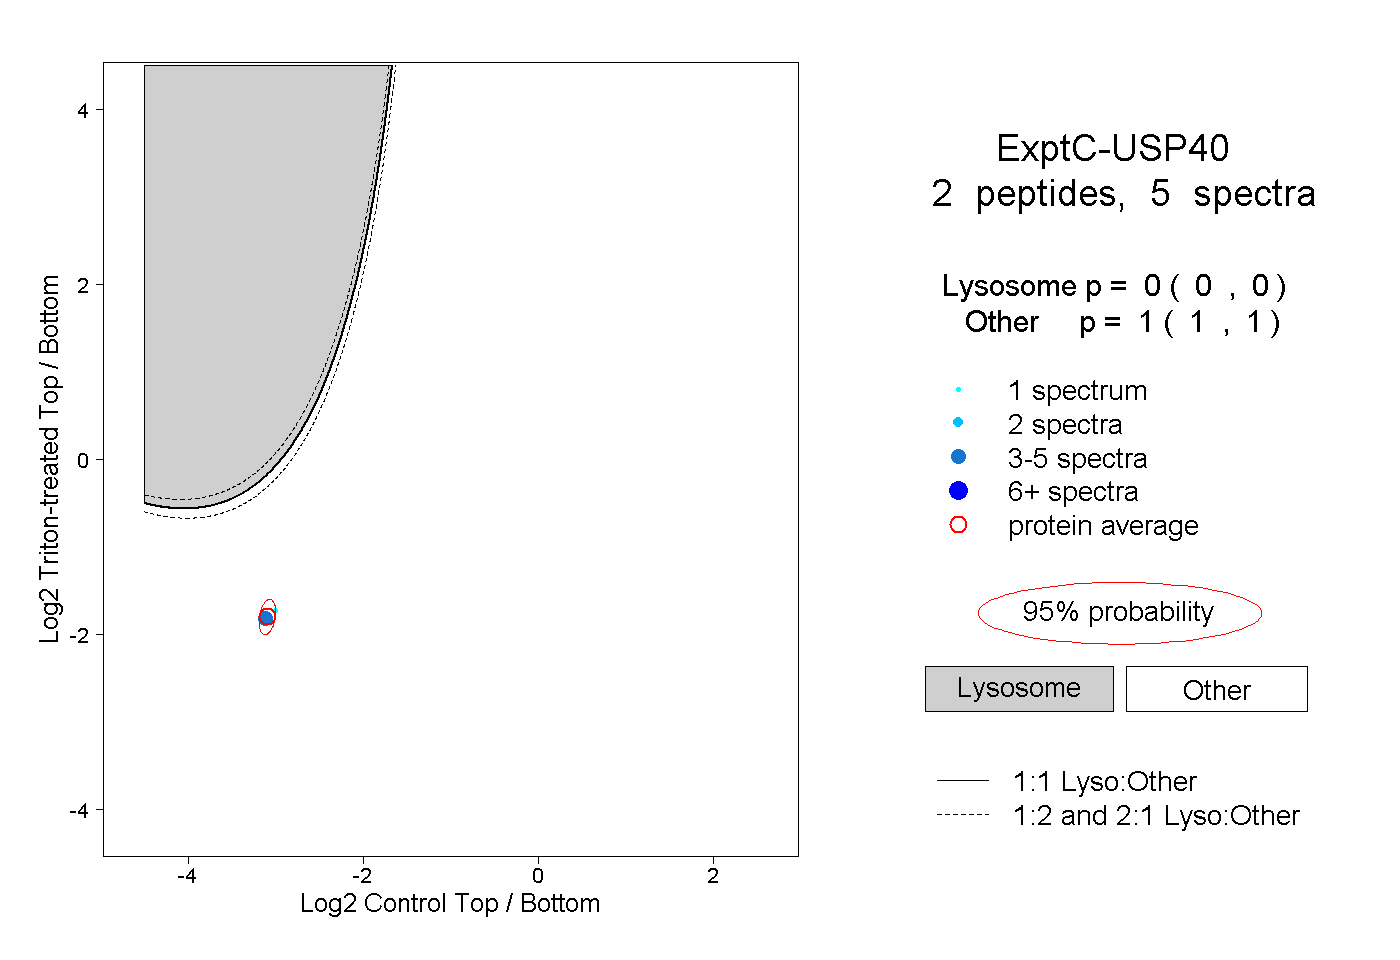 |
0.000 0.000 | 0.000 |
1.000 1.000 | 1.000 |