 11
11peptides
spectra
0.000 | 0.000
0.000 | 0.000
0.000 | 0.000
0.299 | 0.348
0.077 | 0.133
0.000 | 0.000
0.558 | 0.573
0.000 | 0.001
| Plot | Mito | Lyso | Perox | ER | Golgi | PM | Cytosol | Nucleus | |||||
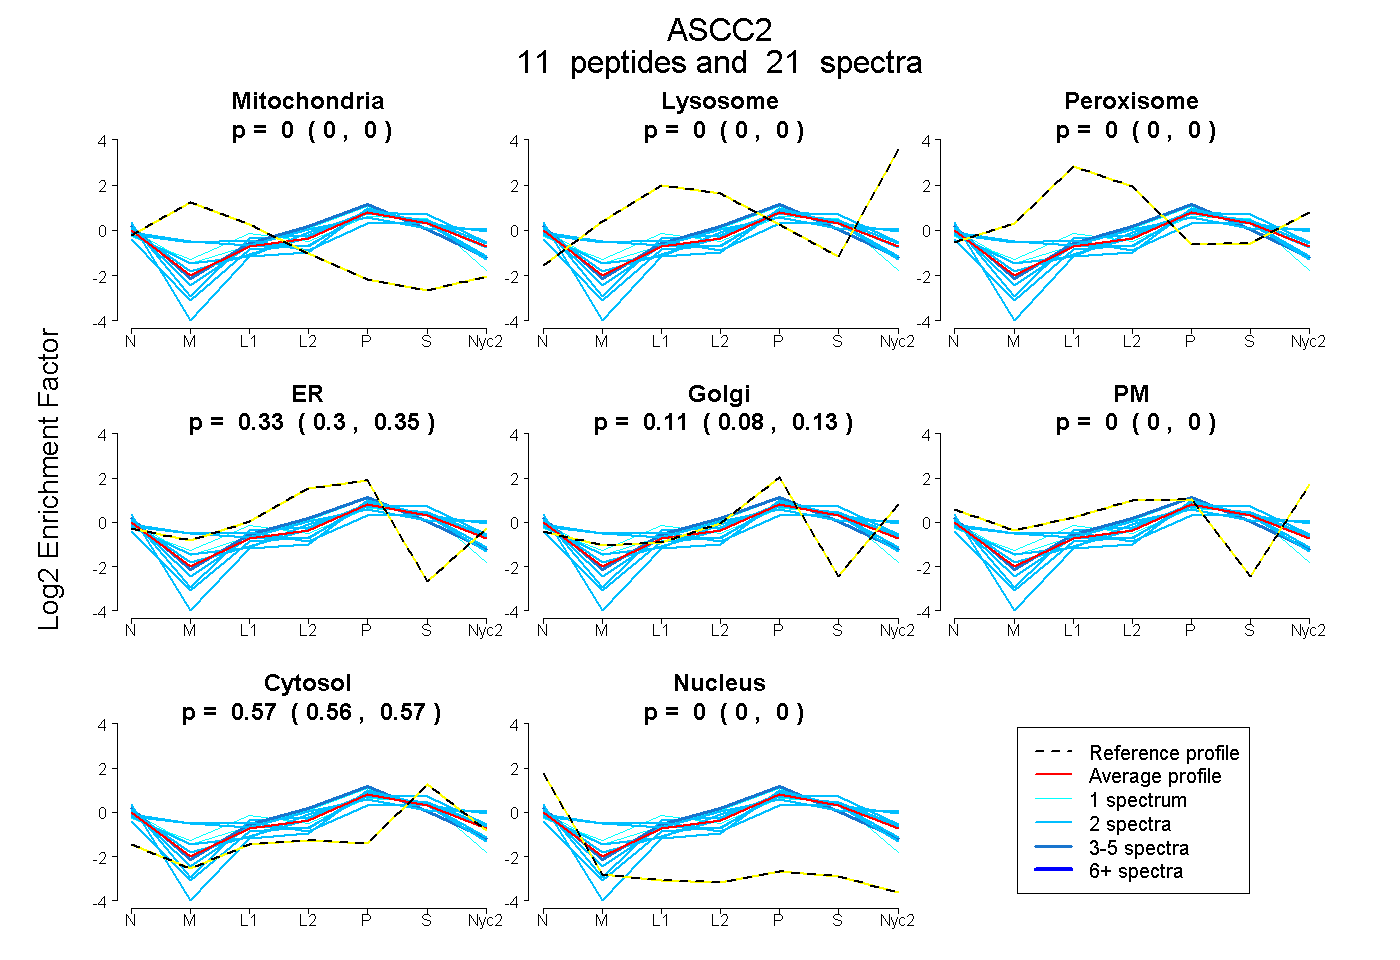
| Expt A |
11 peptides |
21 spectra |
|
0.000 0.000 | 0.000 |
0.000 0.000 | 0.000 |
0.000 0.000 | 0.000 |
0.325 0.299 | 0.348 |
0.108 0.077 | 0.133 |
0.000 0.000 | 0.000 |
0.566 0.558 | 0.573 |
0.000 0.000 | 0.001 |
| 2 spectra, LASFYEMAIPEIESAIK | 0.002 | 0.000 | 0.131 | 0.046 | 0.198 | 0.217 | 0.407 | 0.000 | ||
| 2 spectra, SVFLTFLR | 0.000 | 0.000 | 0.000 | 0.285 | 0.160 | 0.000 | 0.551 | 0.005 | ||
| 2 spectra, QVKPDPTPLLSSR | 0.000 | 0.000 | 0.000 | 0.108 | 0.223 | 0.000 | 0.669 | 0.000 | ||
| 1 spectrum, GNSPLLQK | 0.000 | 0.000 | 0.000 | 0.227 | 0.122 | 0.211 | 0.440 | 0.000 | ||
| 1 spectrum, ANFVANDLDWLLALPHDK | 0.062 | 0.000 | 0.037 | 0.341 | 0.000 | 0.000 | 0.559 | 0.002 | ||
| 3 spectra, LAPELSQLDR | 0.000 | 0.000 | 0.000 | 0.506 | 0.000 | 0.000 | 0.476 | 0.018 | ||
| 2 spectra, LTPSDMPLLELK | 0.176 | 0.000 | 0.070 | 0.114 | 0.156 | 0.000 | 0.483 | 0.000 | ||
| 2 spectra, HNVFQNDEFDVFSR | 0.000 | 0.000 | 0.000 | 0.179 | 0.101 | 0.164 | 0.557 | 0.000 | ||
| 2 spectra, LLGDMWQR | 0.000 | 0.000 | 0.000 | 0.306 | 0.119 | 0.017 | 0.559 | 0.000 | ||
| 2 spectra, QAVVAQWQR | 0.000 | 0.000 | 0.000 | 0.198 | 0.218 | 0.000 | 0.570 | 0.013 | ||
| 2 spectra, RPFTIPQVLR | 0.000 | 0.000 | 0.000 | 0.121 | 0.179 | 0.000 | 0.574 | 0.126 |
| Plot | Mito | Lyso or Perox | ER | Golgi | PM | Cytosol | Nucleus | ||||||
| Expt B |
3 peptides |
5 spectra |
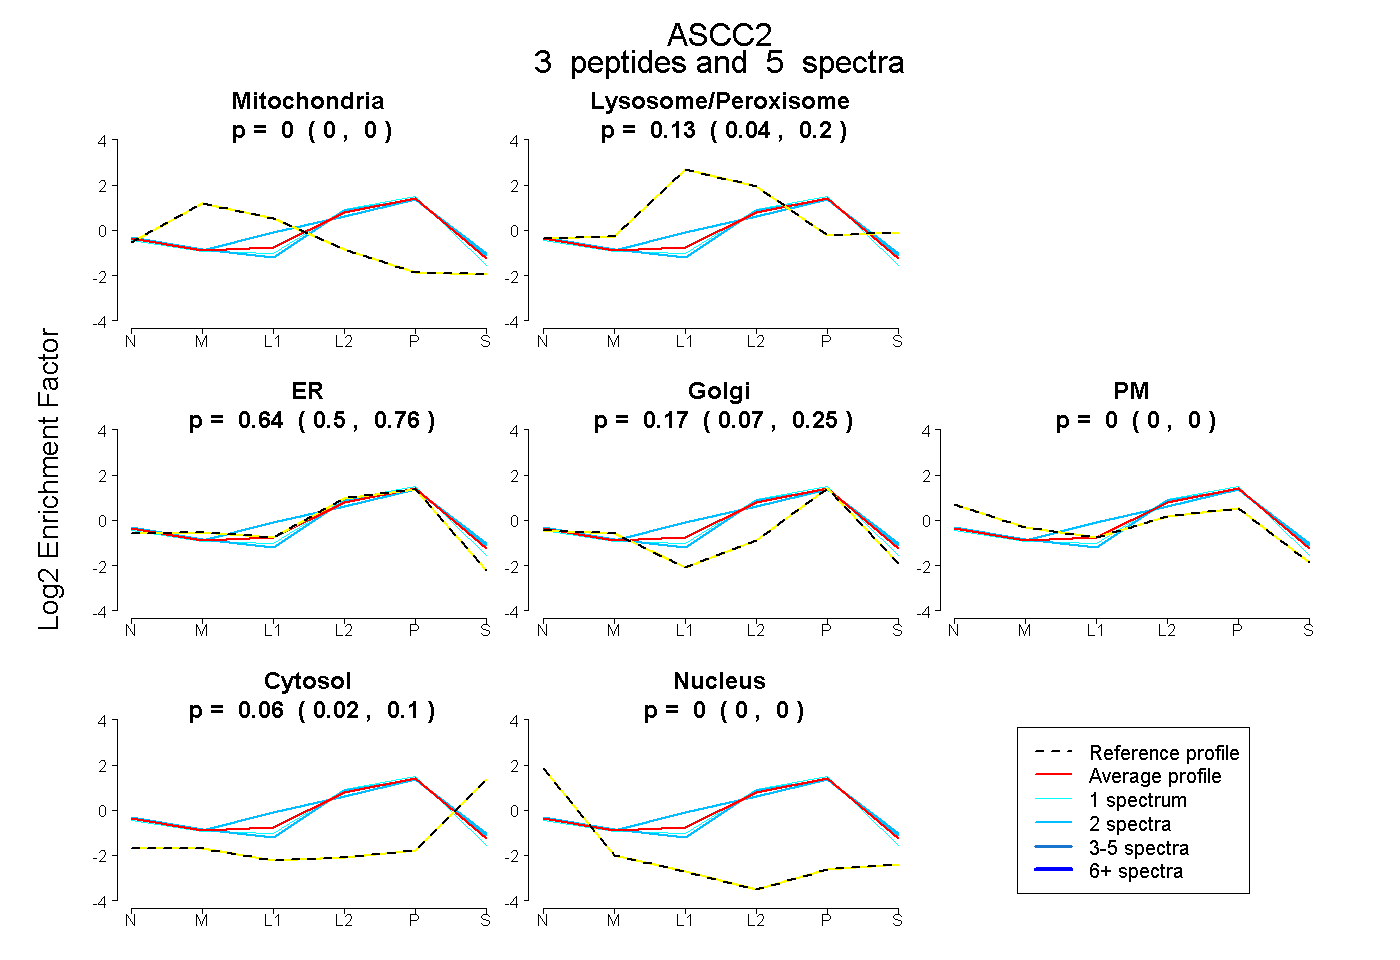 |
0.000 0.000 | 0.000 |
0.126 0.041 | 0.196 |
0.643 0.499 | 0.760 |
0.172 0.074 | 0.255 |
0.000 0.000 | 0.000 |
0.059 0.018 | 0.096 |
0.000 0.000 | 0.000 |
|||
| Plot | Lyso | Other | |||||||||||
| Expt C |
6 peptides |
10 spectra |
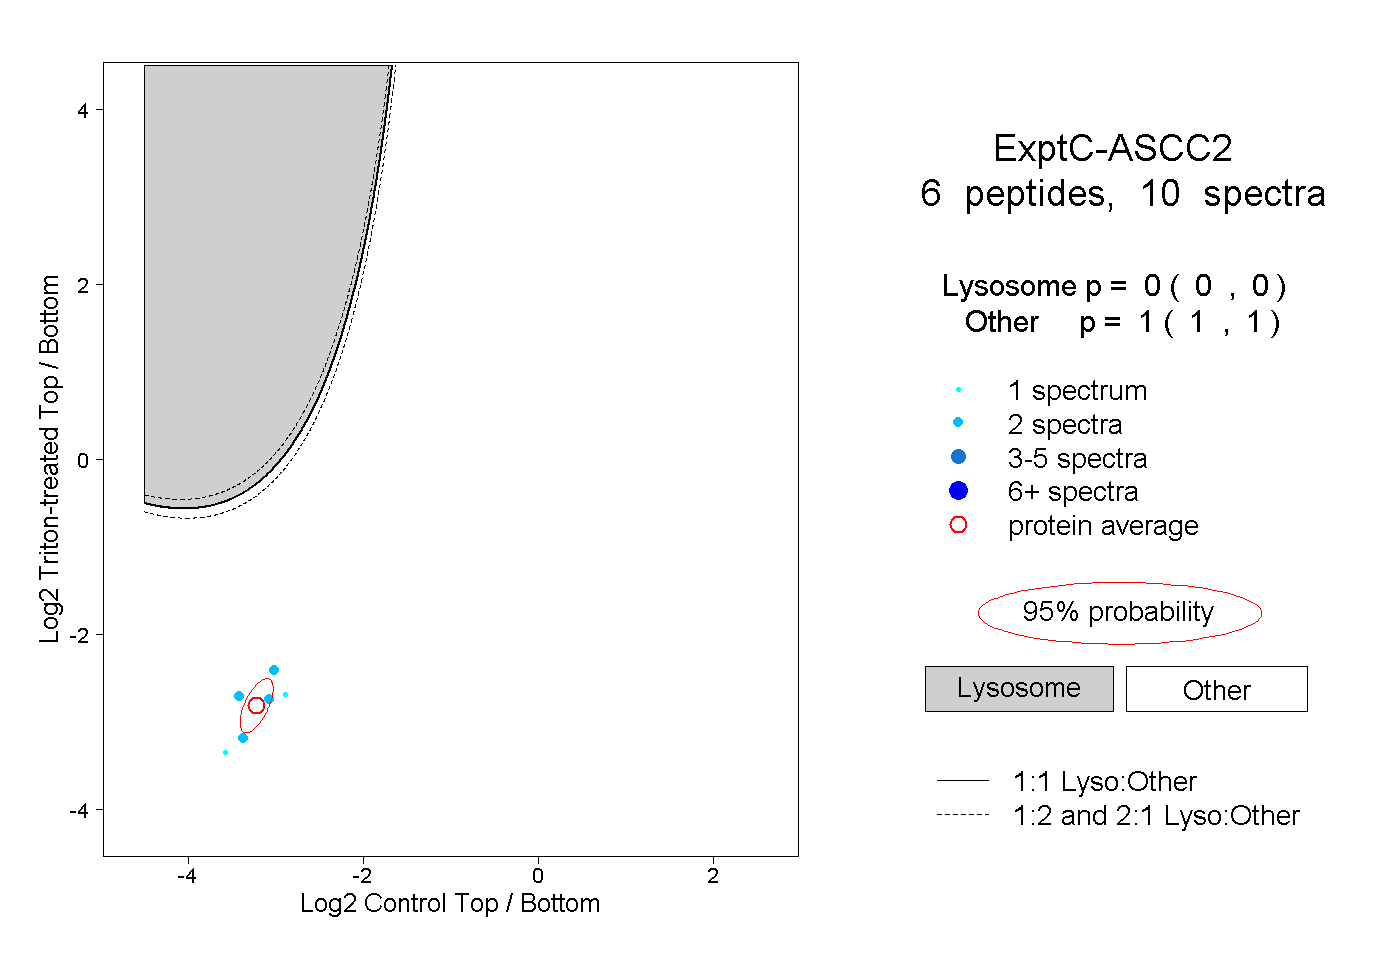 |
0.000 0.000 | 0.000 |
1.000 1.000 | 1.000 |