 2
2peptides
spectra
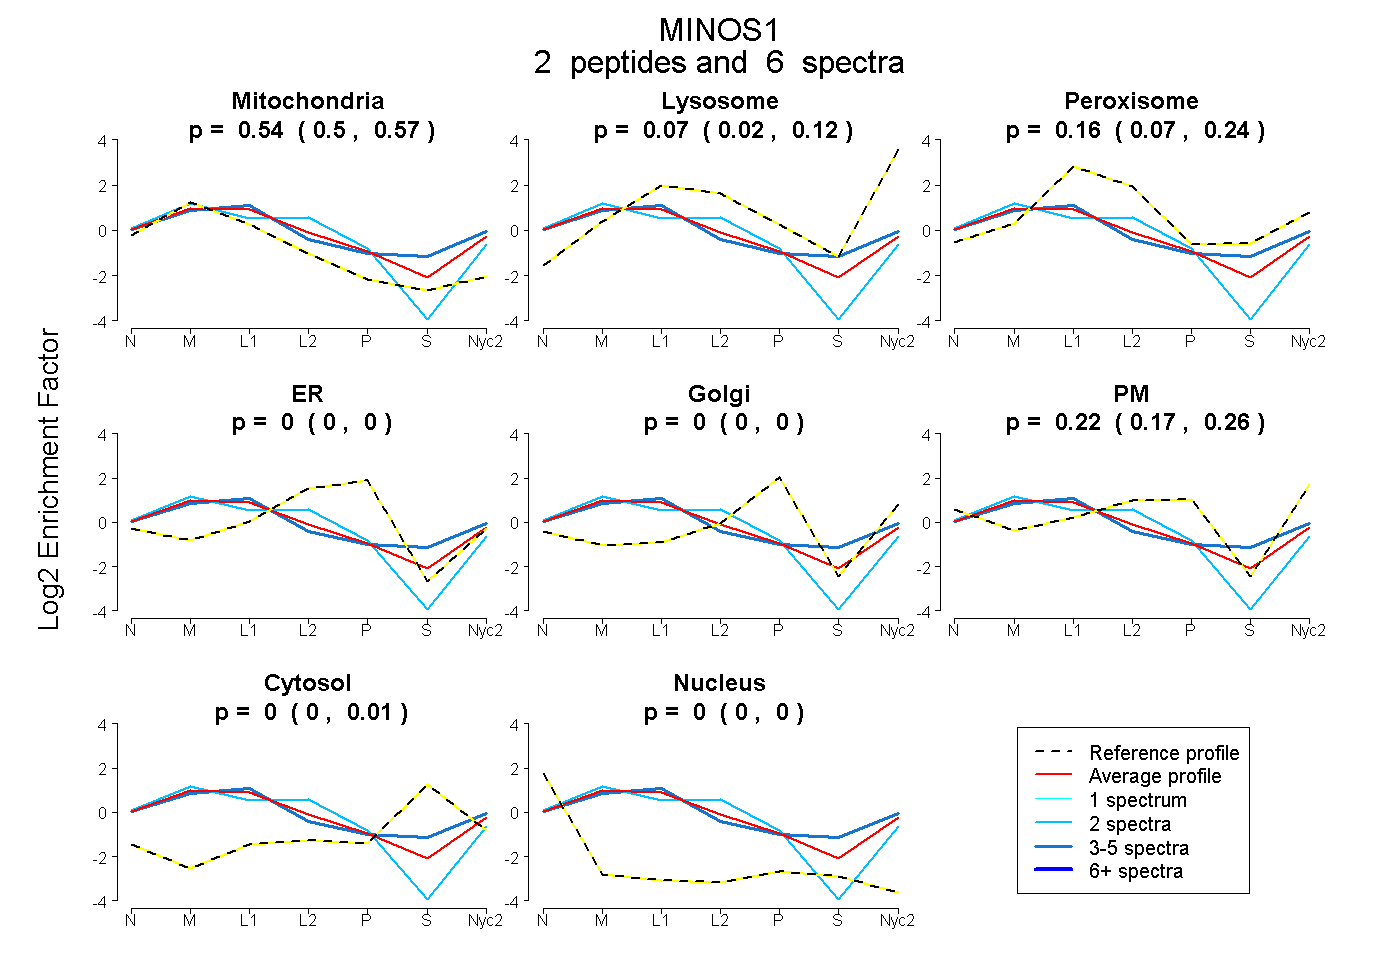
0.504 | 0.575
0.019 | 0.122
0.069 | 0.240
0.000 | 0.000
0.000 | 0.000
0.171 | 0.257
0.000 | 0.011
0.000 | 0.000
1peptide
spectra
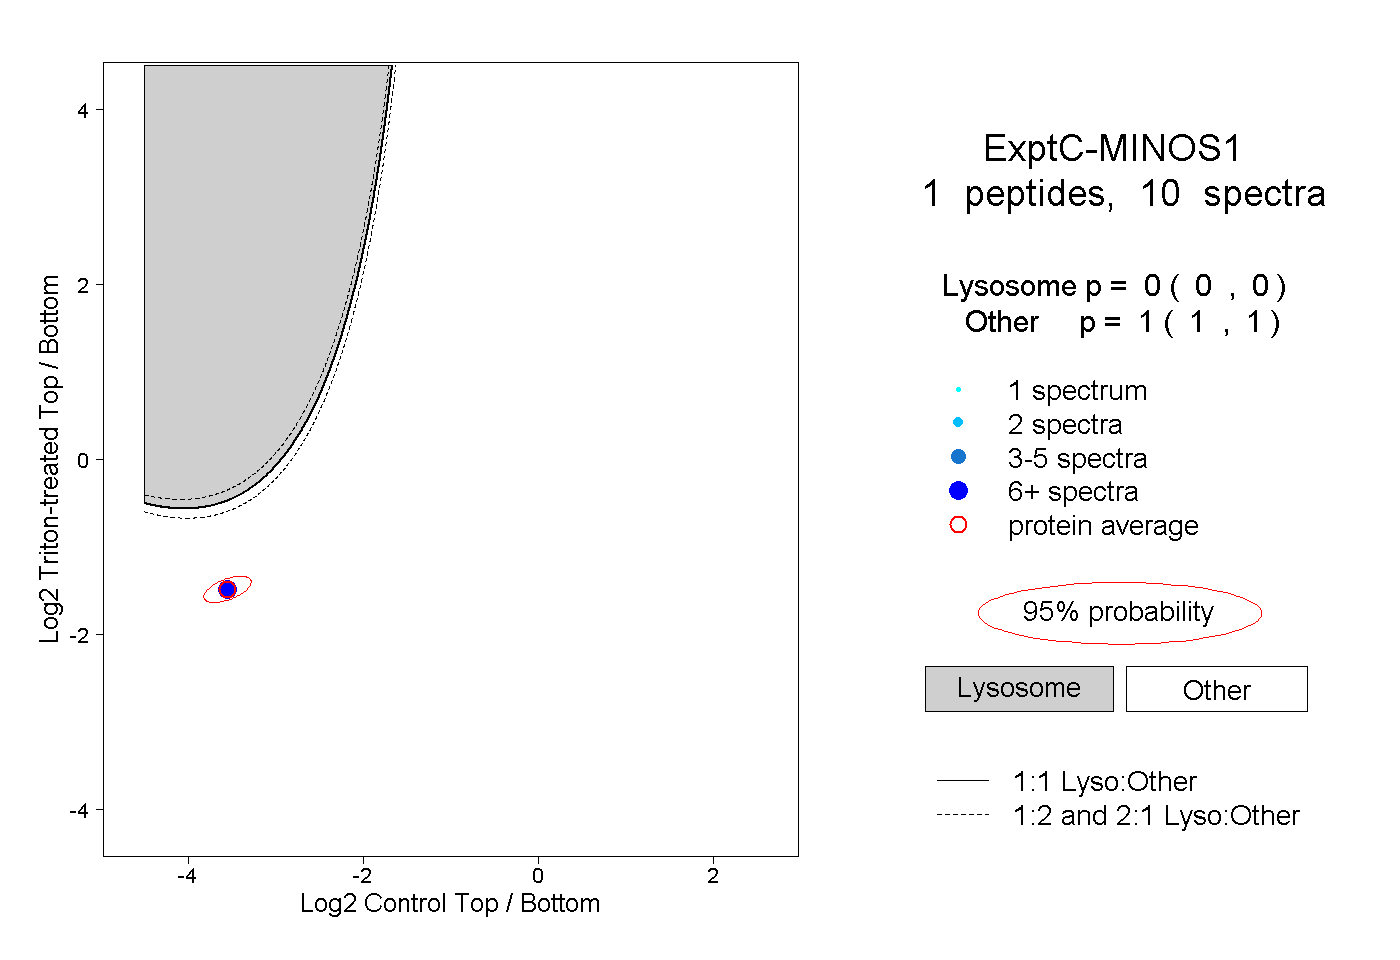
0.000 | 0.000
1.000 | 1.000
| Plot | Mito | Lyso | Perox | ER | Golgi | PM | Cytosol | Nucleus | |||||
| Expt A |
2 peptides |
6 spectra |
|
0.545 0.504 | 0.575 |
0.075 0.019 | 0.122 |
0.161 0.069 | 0.240 |
0.000 0.000 | 0.000 |
0.000 0.000 | 0.000 |
0.220 0.171 | 0.257 |
0.000 0.000 | 0.011 |
0.000 0.000 | 0.000 |
||
| Plot | Lyso | Other | |||||||||||
| Expt C |
1 peptide |
10 spectra |
|
0.000 0.000 | 0.000 |
1.000 1.000 | 1.000 |