 6
6peptides
spectra
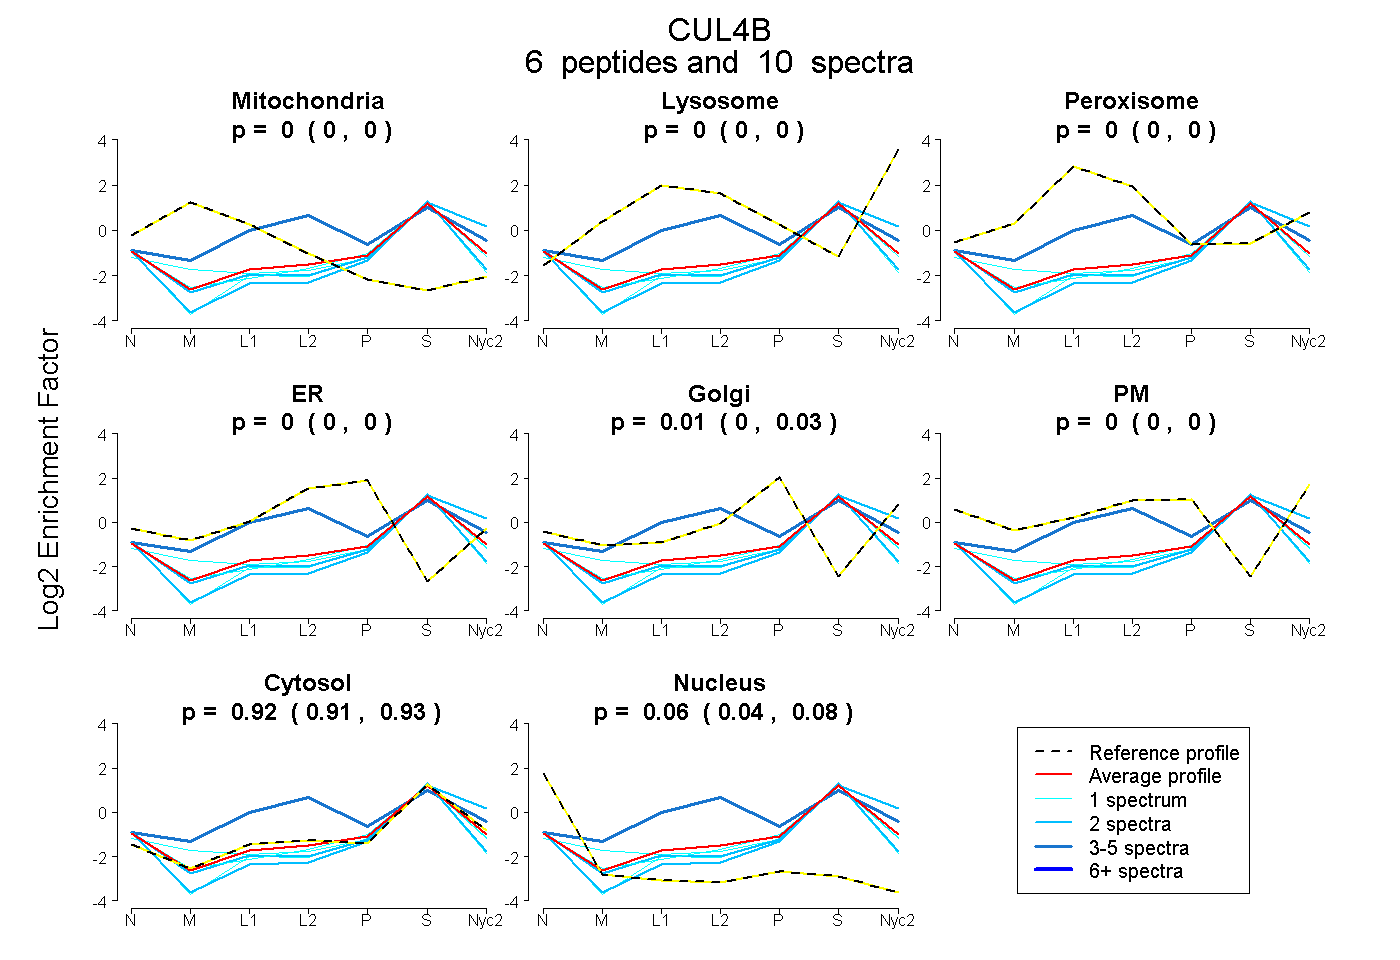
0.000 | 0.000
0.000 | 0.000
0.000 | 0.000
0.000 | 0.000
0.000 | 0.034
0.000 | 0.000
0.908 | 0.930
0.042 | 0.082
| Plot | Mito | Lyso | Perox | ER | Golgi | PM | Cytosol | Nucleus | |||||
| Expt A |
6 peptides |
10 spectra |
|
0.000 0.000 | 0.000 |
0.000 0.000 | 0.000 |
0.000 0.000 | 0.000 |
0.000 0.000 | 0.000 |
0.015 0.000 | 0.034 |
0.000 0.000 | 0.000 |
0.921 0.908 | 0.930 |
0.064 0.042 | 0.082 |
| 2 spectra, ETVEEQASTTER | 0.000 | 0.000 | 0.000 | 0.000 | 0.000 | 0.000 | 0.822 | 0.178 | ||
| 3 spectra, AQIHQFR | 0.000 | 0.000 | 0.365 | 0.057 | 0.000 | 0.000 | 0.577 | 0.000 | ||
| 1 spectrum, EAFETFINK | 0.057 | 0.000 | 0.000 | 0.000 | 0.000 | 0.000 | 0.895 | 0.048 | ||
| 1 spectrum, TIDGILLLIER | 0.000 | 0.000 | 0.000 | 0.000 | 0.000 | 0.000 | 0.908 | 0.092 | ||
| 2 spectra, GLNSLLDENR | 0.000 | 0.000 | 0.000 | 0.000 | 0.039 | 0.000 | 0.944 | 0.017 | ||
| 1 spectrum, EATDEELEK | 0.000 | 0.000 | 0.000 | 0.000 | 0.000 | 0.000 | 0.842 | 0.158 |
| Plot | Lyso | Other | |||||||||||
| Expt C |
1 peptide |
1 spectrum |
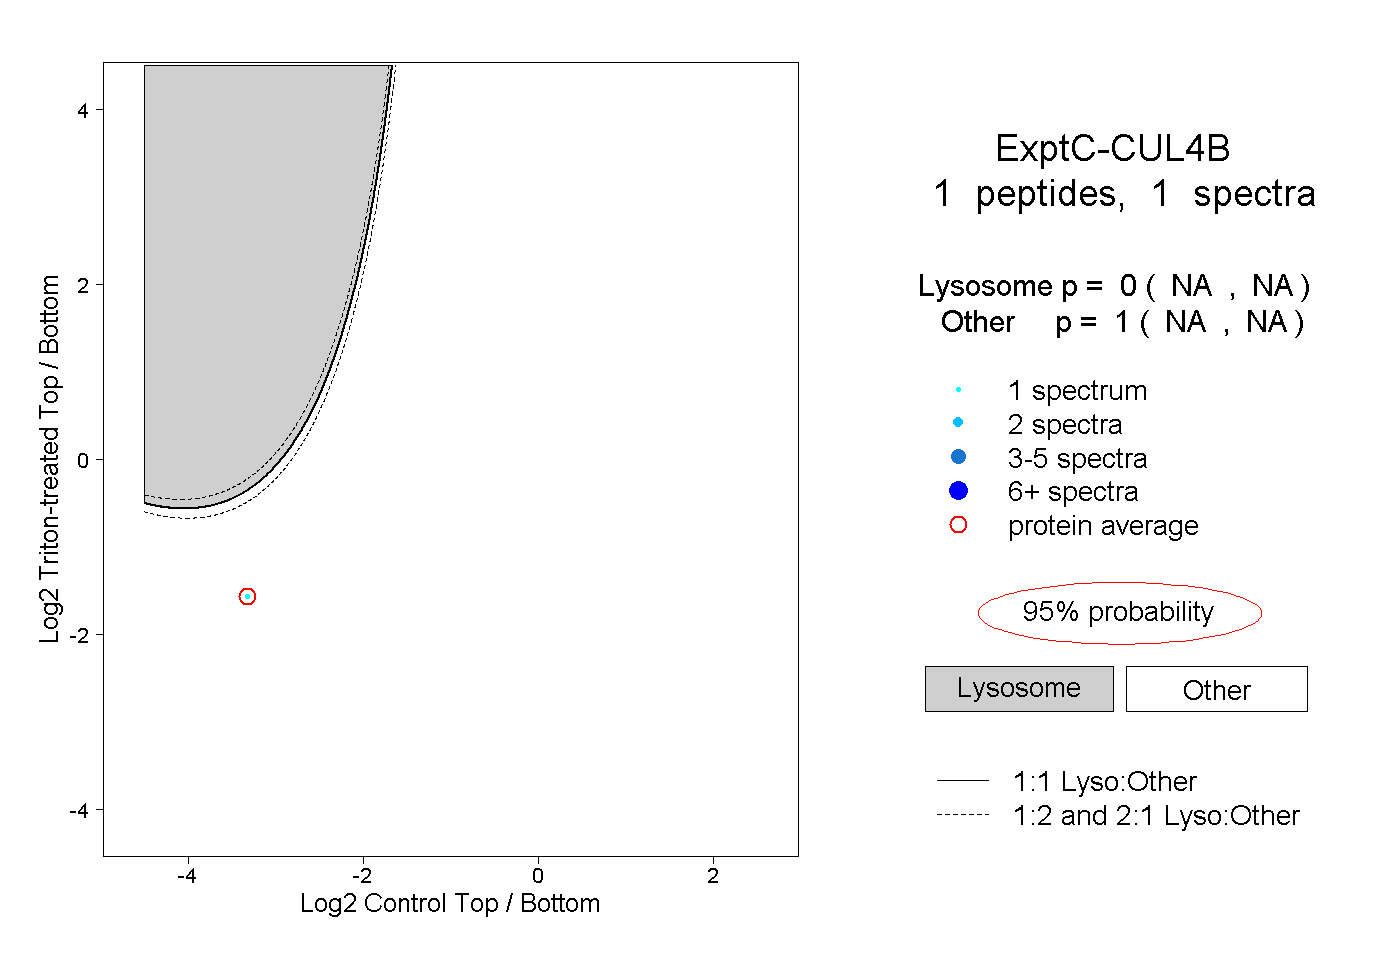 |
0.000 NA | NA |
1.000 NA | NA |
||||||||
| Plot | Lyso | Other | |||||||||||
| Expt D |
1 peptide |
1 spectrum |
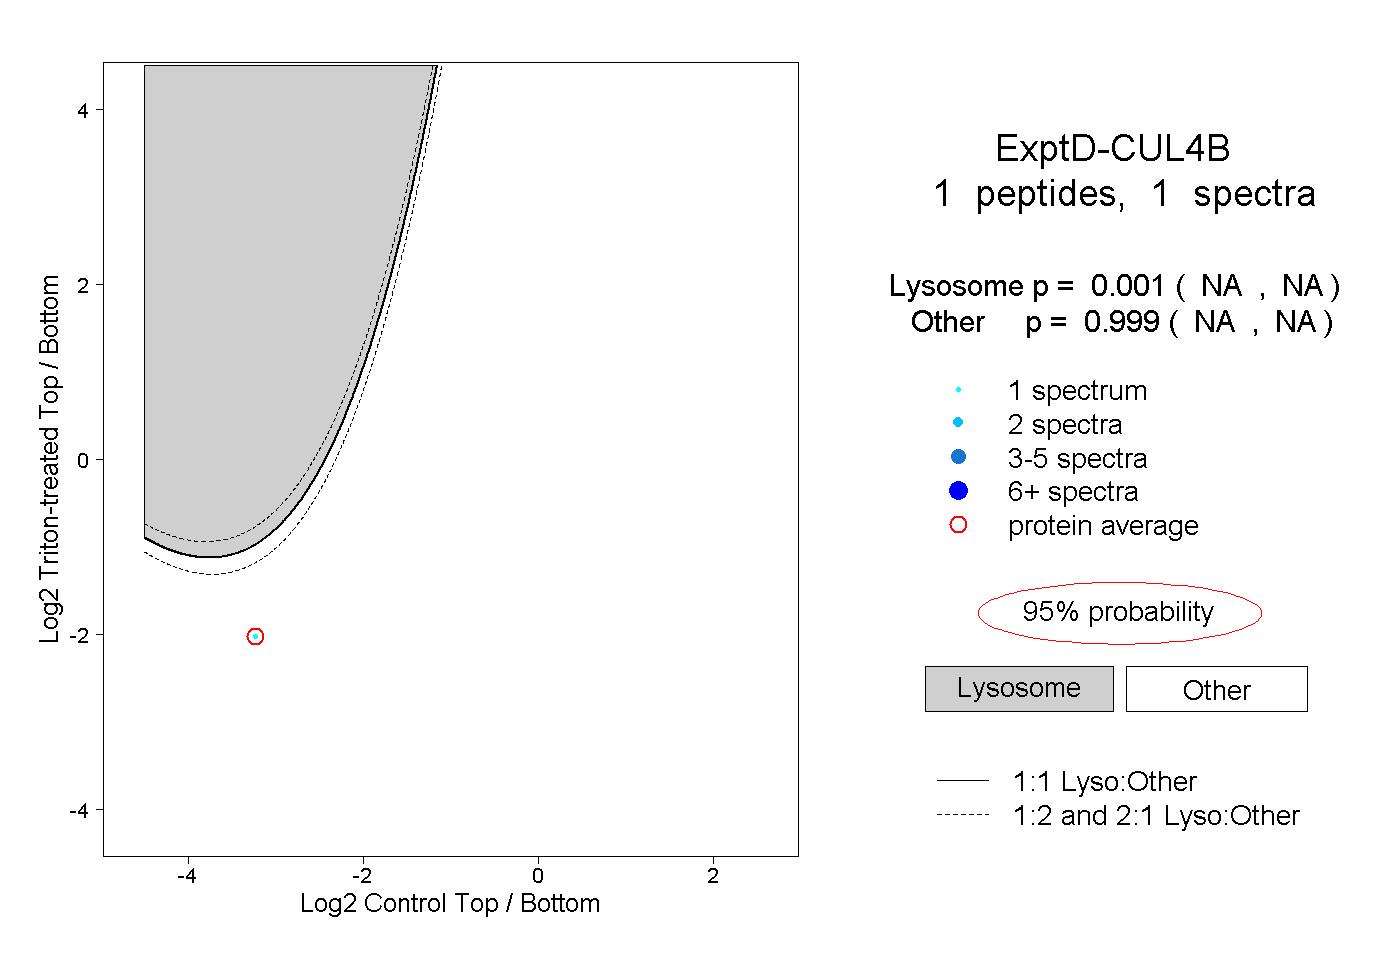 |
0.001 NA | NA |
0.999 NA | NA |