 4
4peptides
spectra
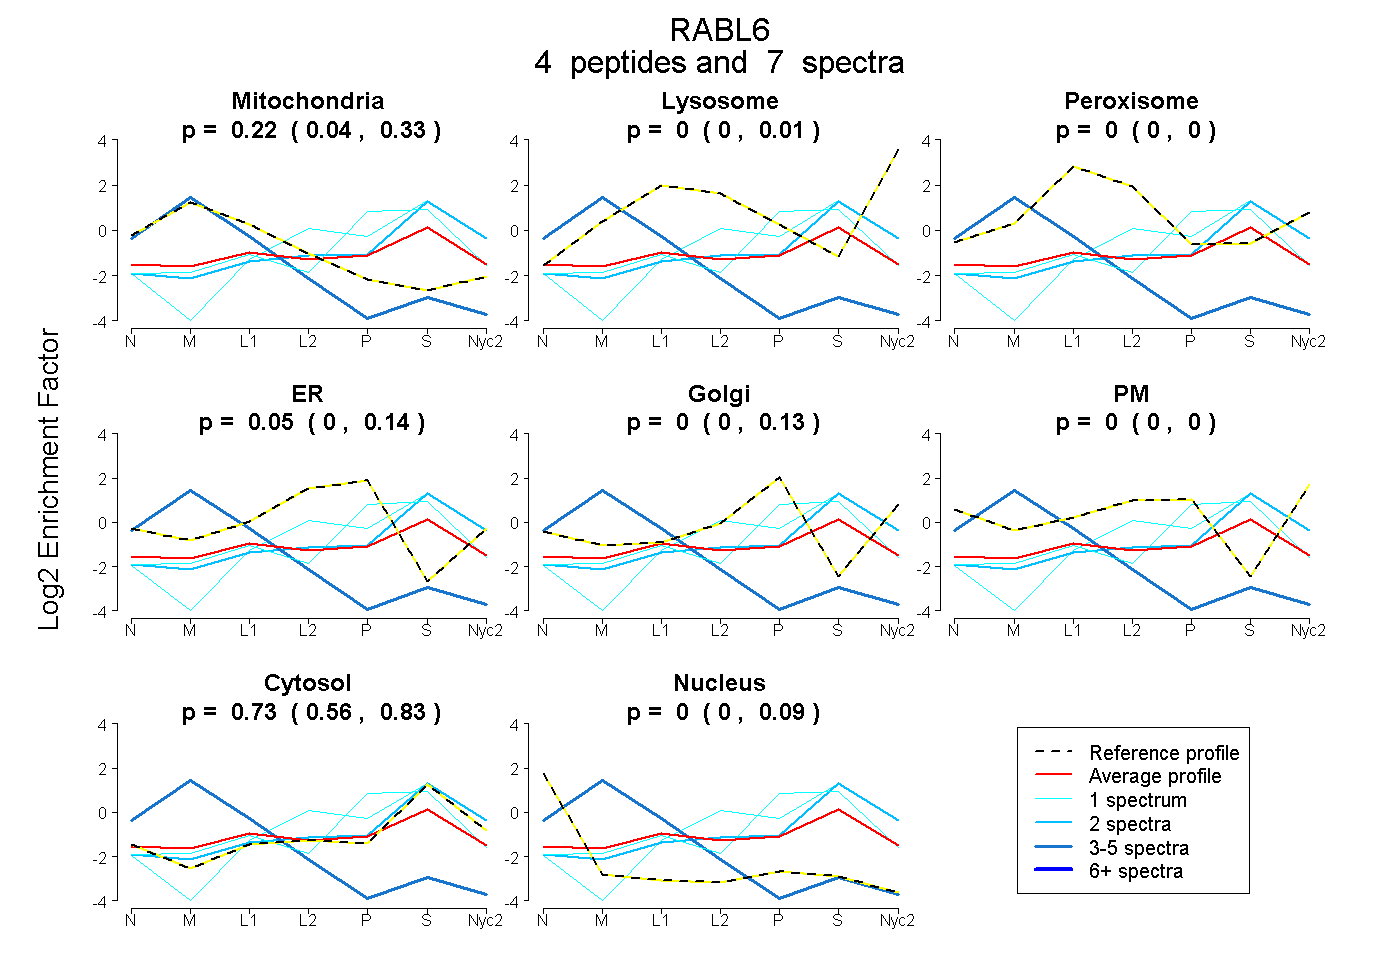
0.036 | 0.333
0.000 | 0.012
0.000 | 0.001
0.000 | 0.140
0.000 | 0.129
0.000 | 0.000
0.559 | 0.825
0.000 | 0.092
2peptides
spectra

NA | NA
NA | NA
NA | NA
NA | NA
NA | NA
NA | NA
NA | NA
3peptides
spectra
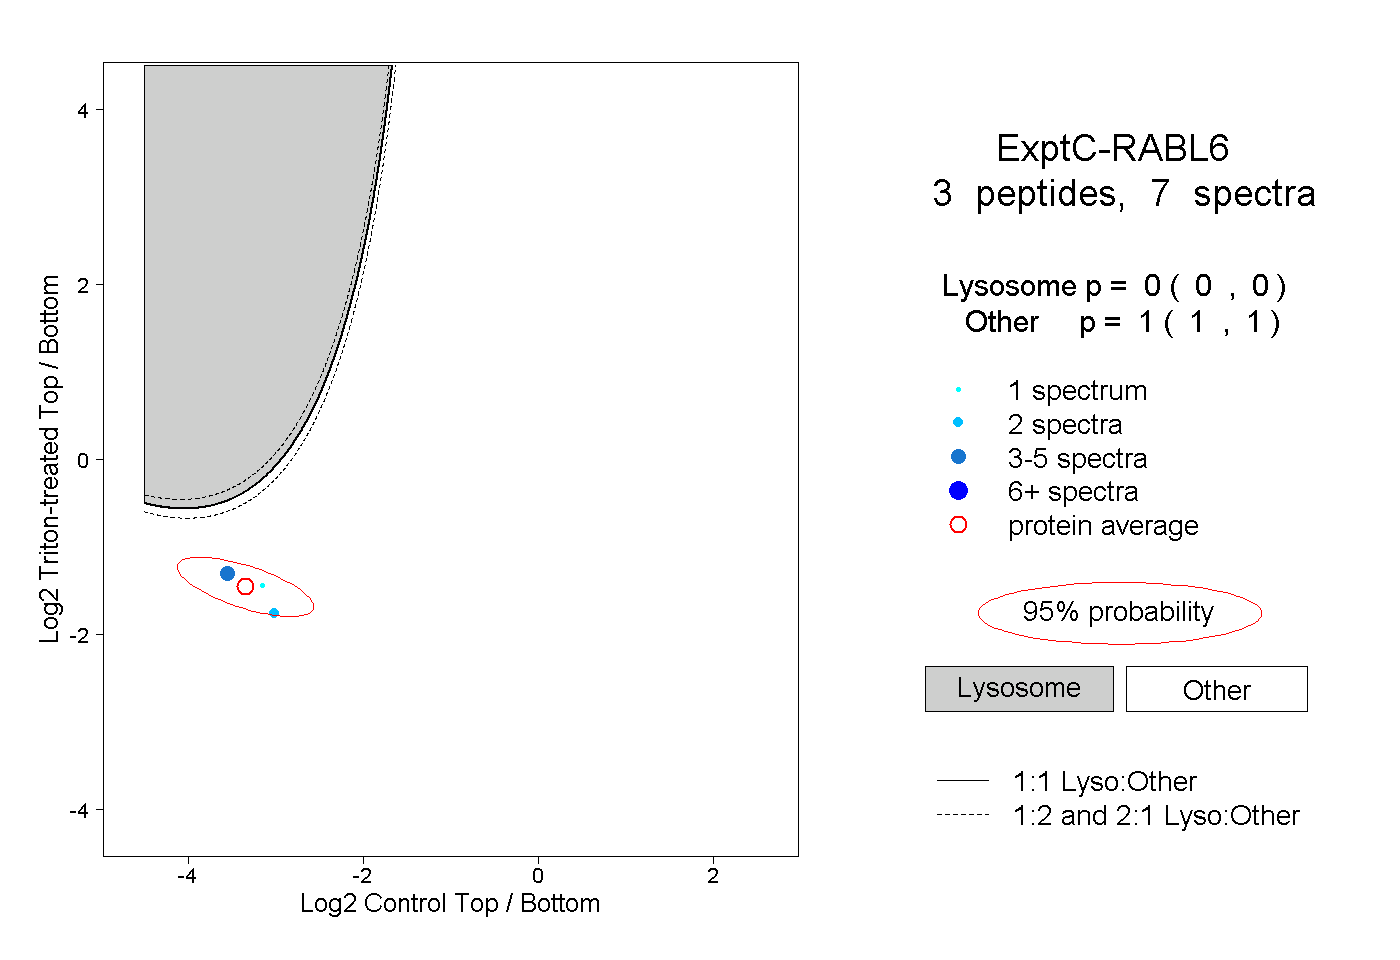
0.000 | 0.000
1.000 | 1.000
1peptide
spectra
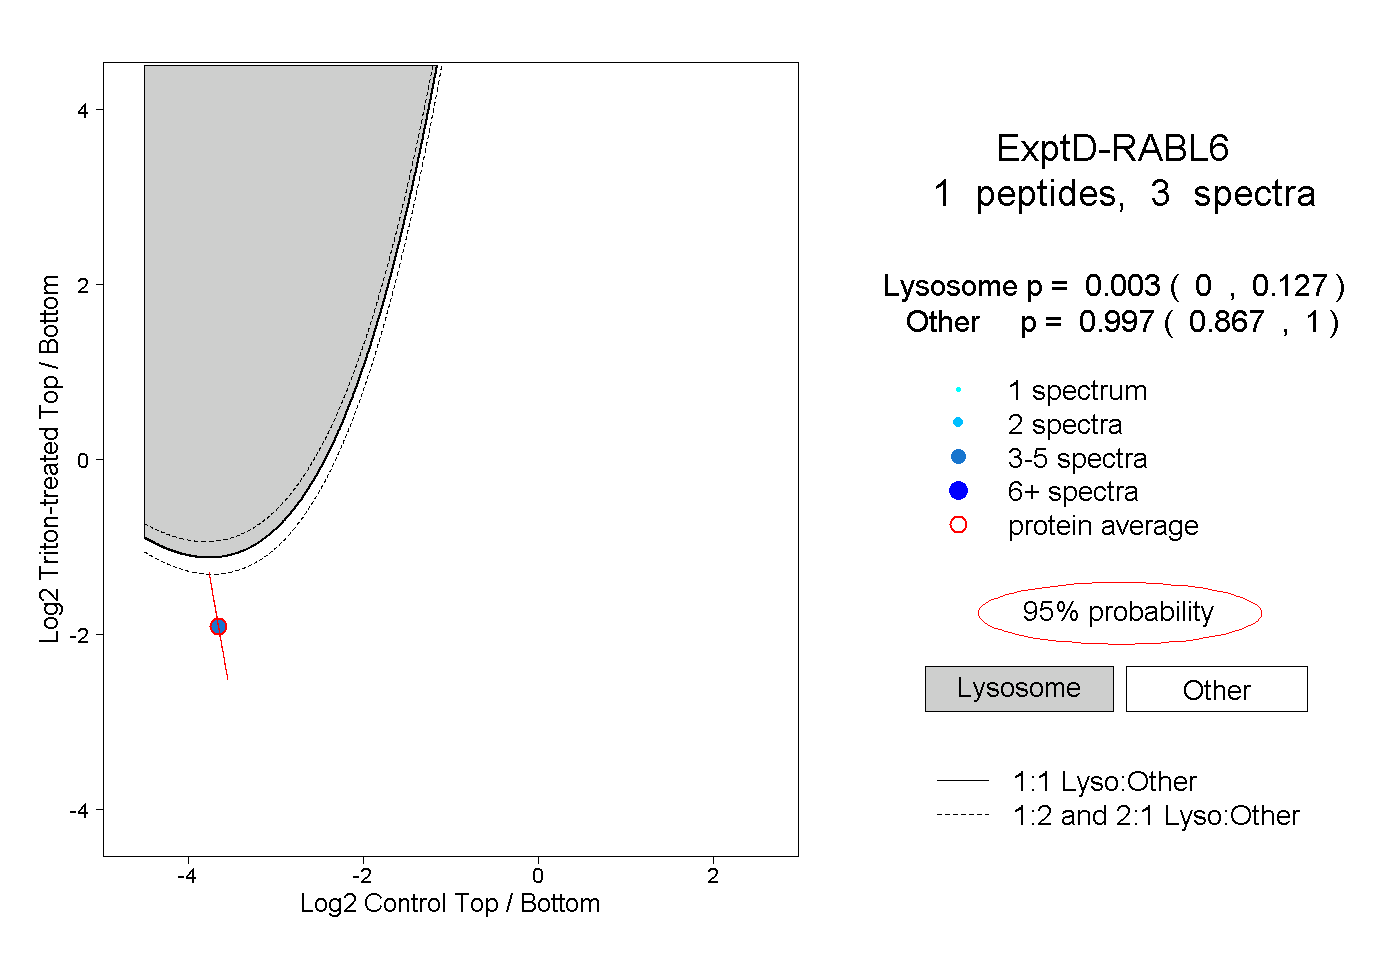
0.000 | 0.127
0.867 | 1.000