 3
3peptides
spectra
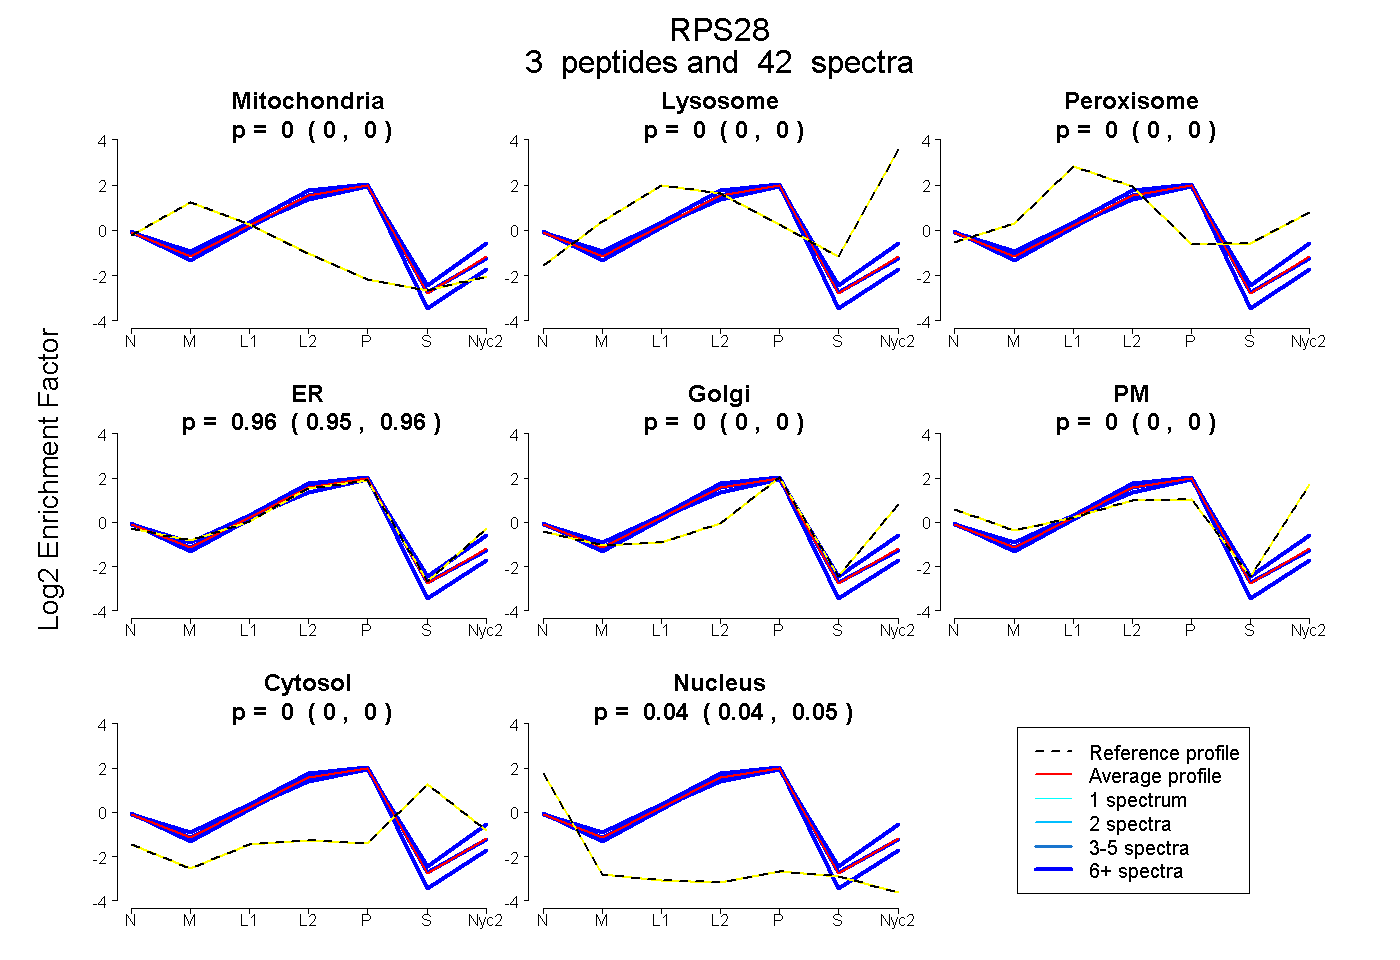
0.000 | 0.000
0.000 | 0.000
0.000 | 0.000
0.951 | 0.960
0.000 | 0.000
0.000 | 0.000
0.000 | 0.000
0.039 | 0.048
3peptides
spectra
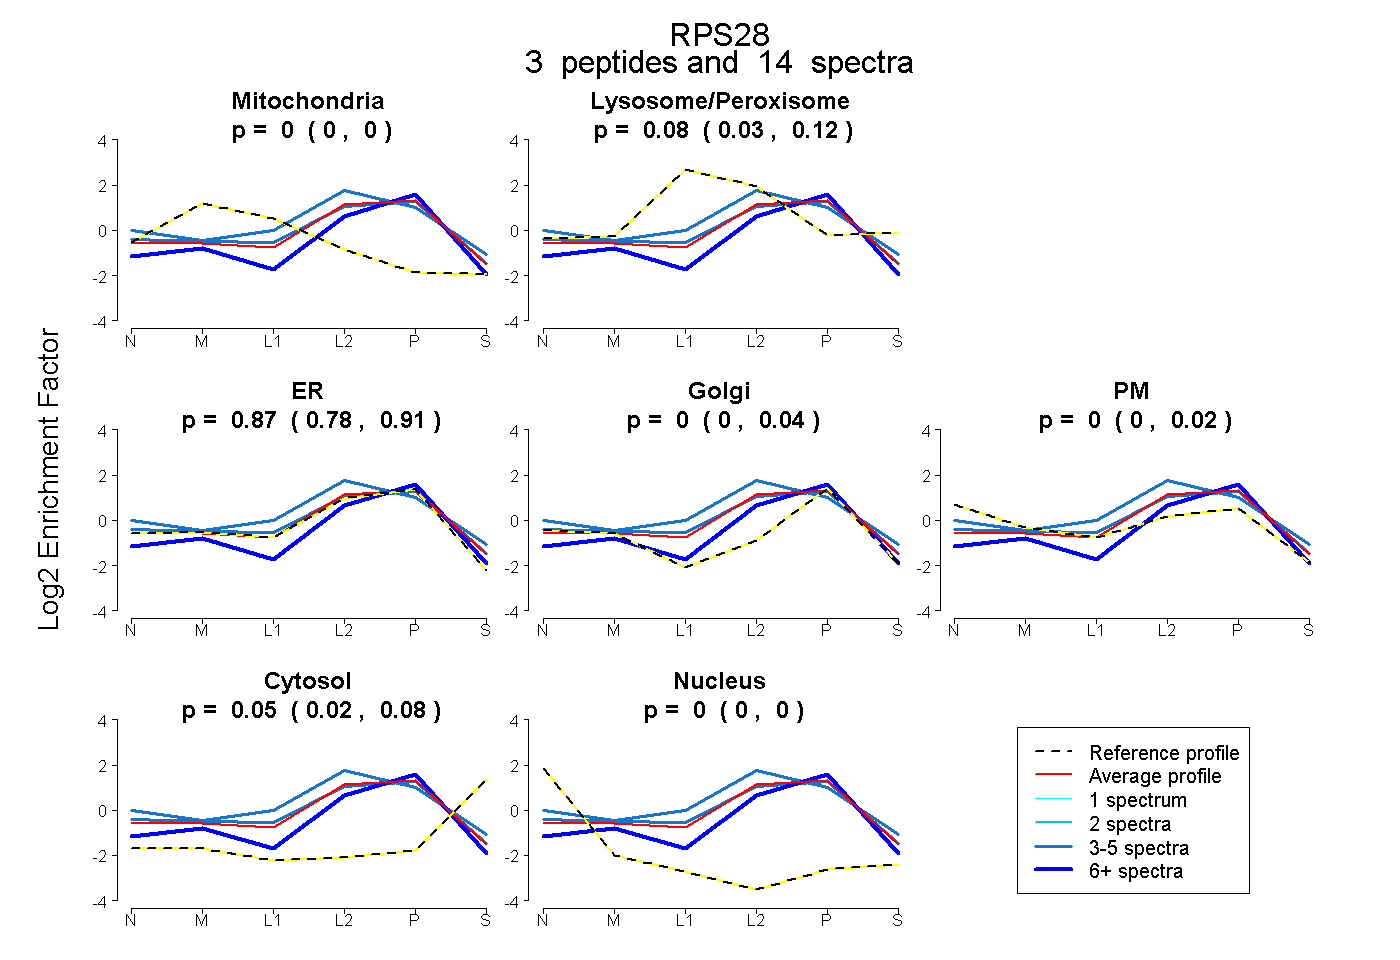
0.000 | 0.000
0.025 | 0.122
0.781 | 0.906
0.000 | 0.037
0.000 | 0.018
0.024 | 0.076
0.000 | 0.000
3peptides
spectra
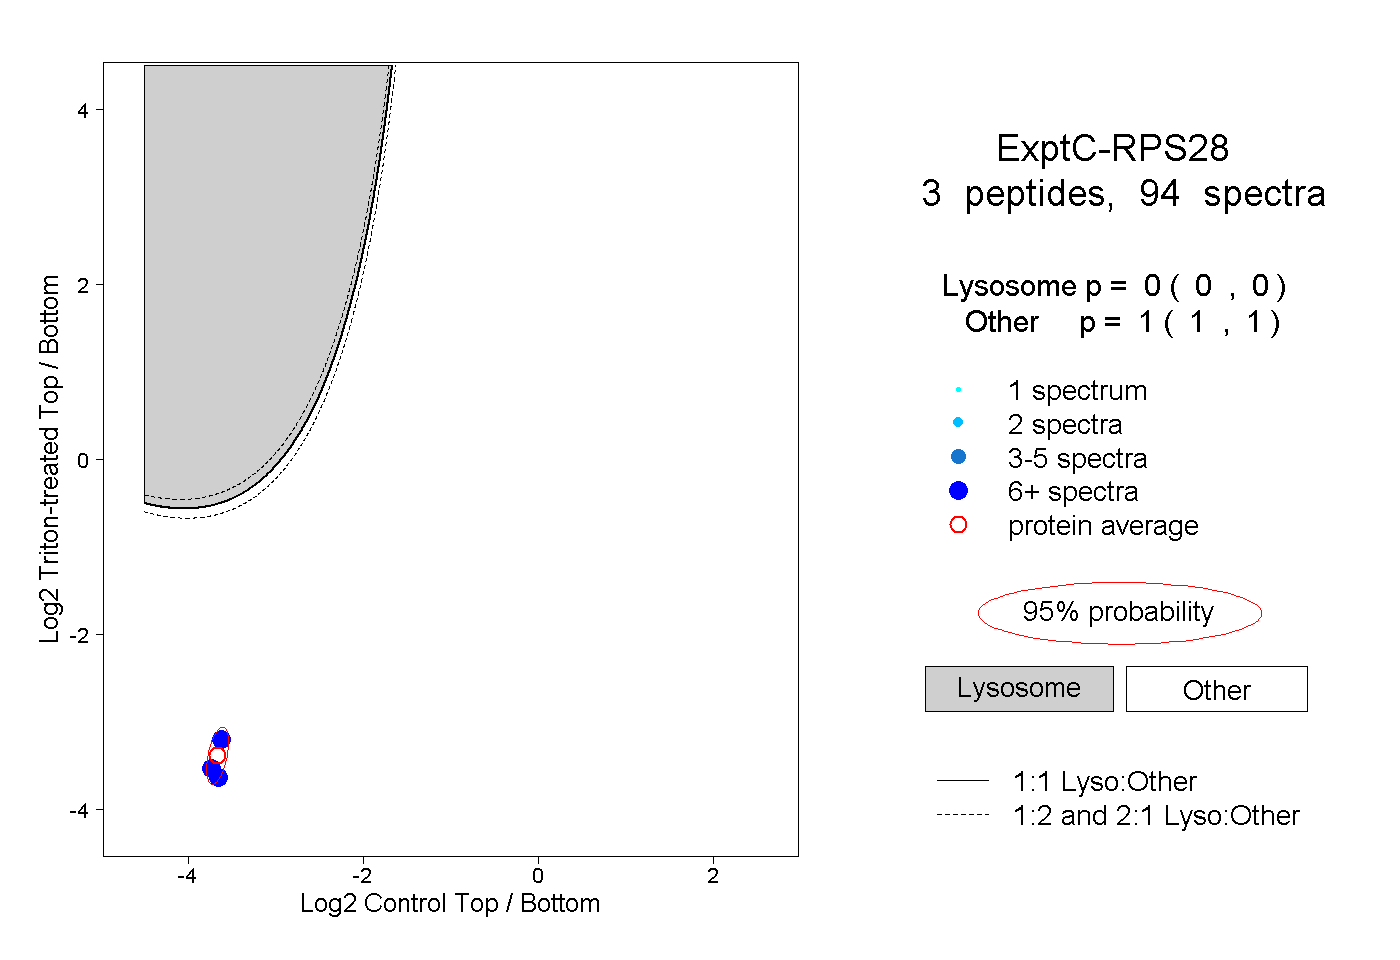
0.000 | 0.000
1.000 | 1.000
1peptide
spectrum
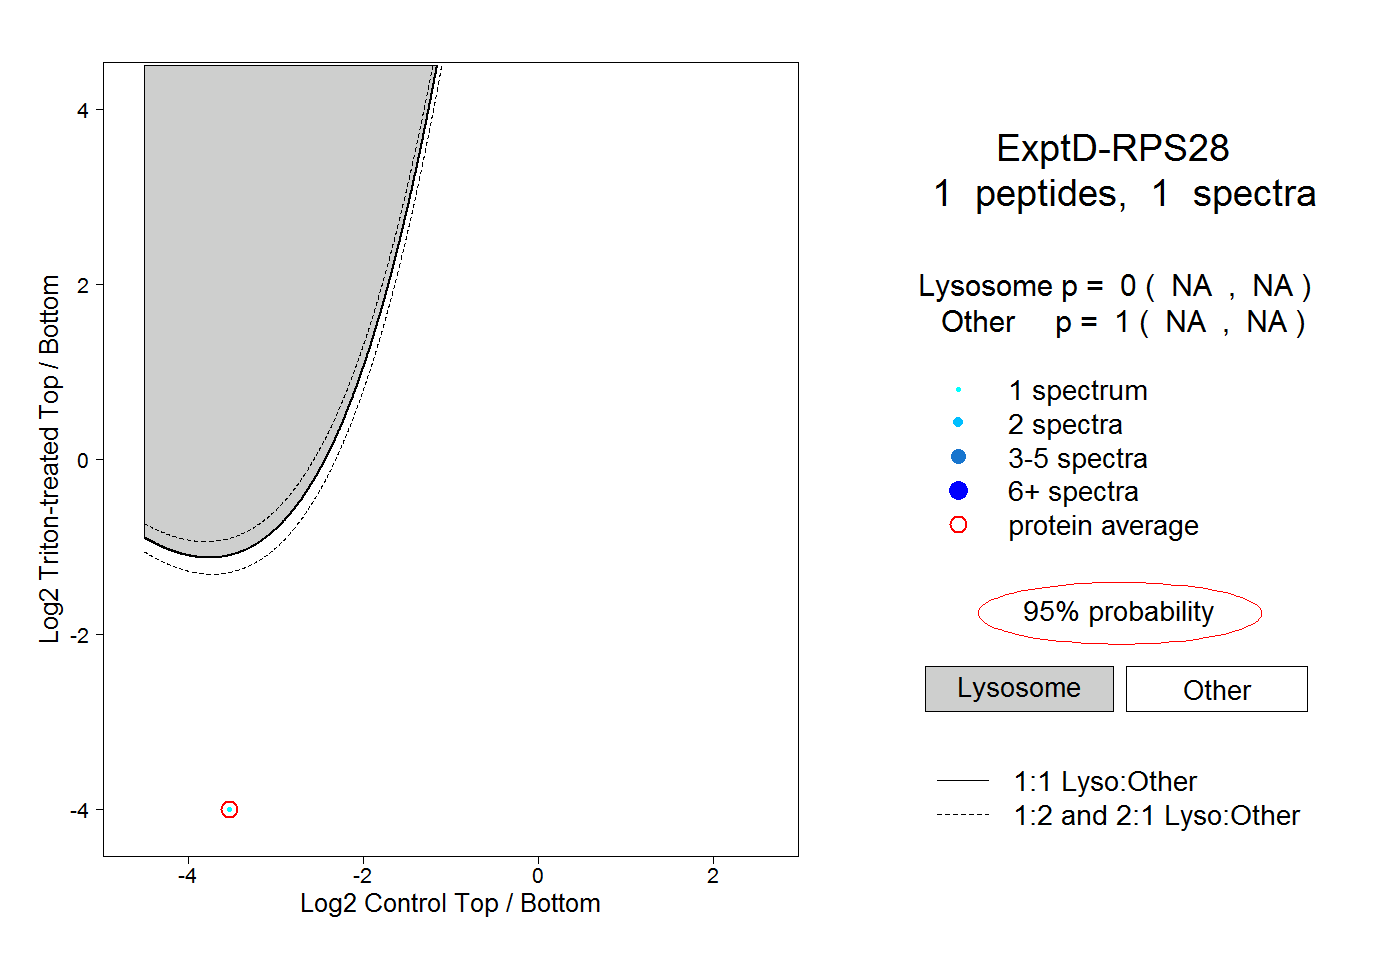
NA | NA
NA | NA