 3
3peptides
spectra
0.000 | 0.044
0.000 | 0.024
0.000 | 0.286
0.000 | 0.361
0.000 | 0.405
0.000 | 0.402
0.199 | 0.480
0.000 | 0.106
8peptides
spectra
0.000 | 0.000
1.000 | 1.000
| Plot | Mito | Lyso | Perox | ER | Golgi | PM | Cytosol | Nucleus | |||||
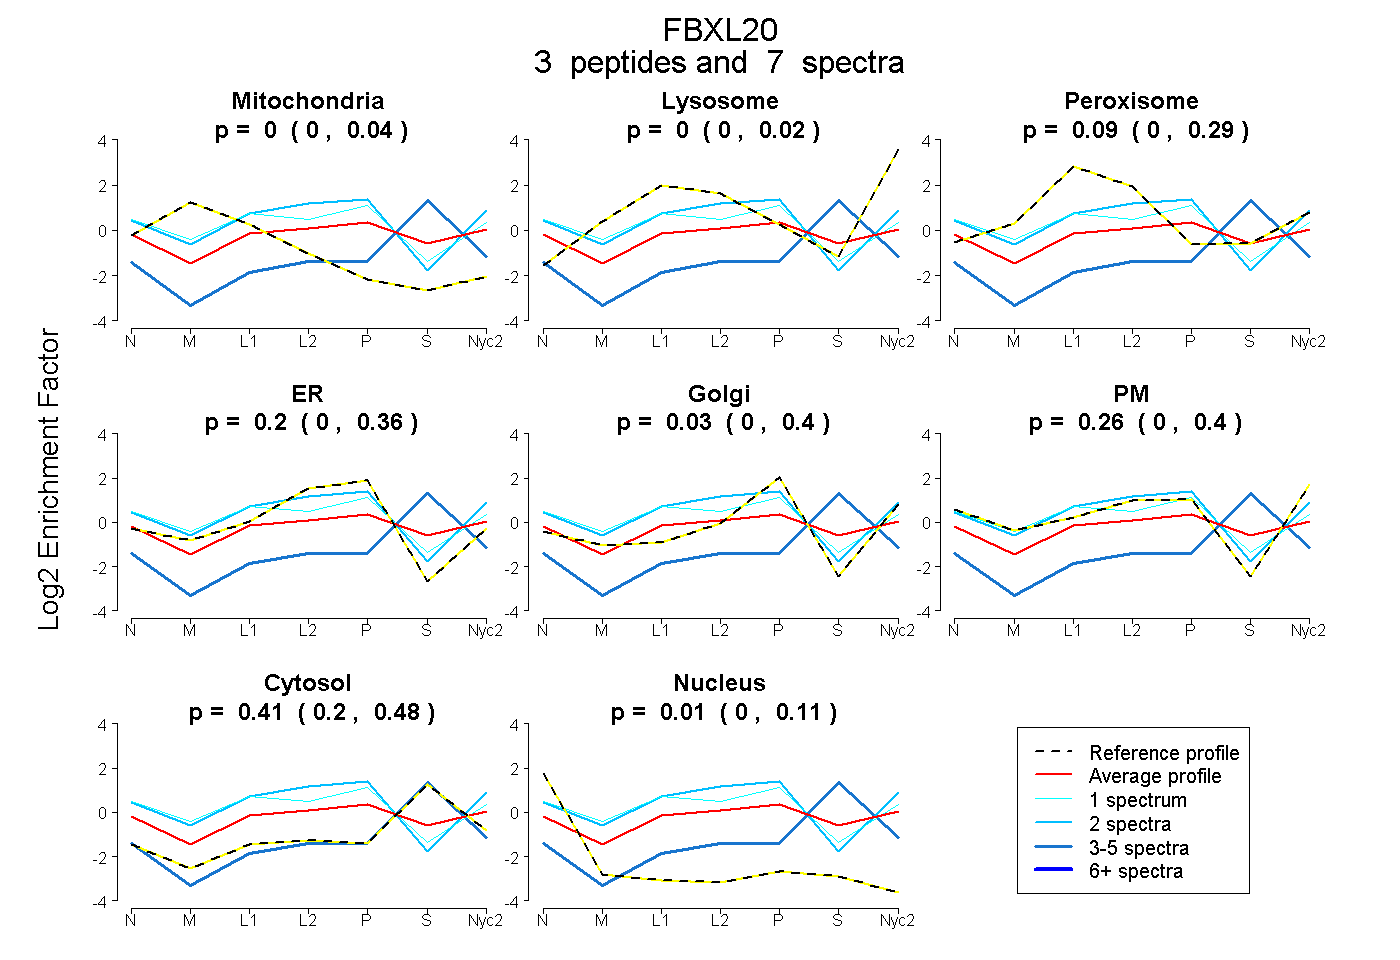
| Expt A |
3 peptides |
7 spectra |
|
0.000 0.000 | 0.044 |
0.000 0.000 | 0.024 |
0.087 0.000 | 0.286 |
0.202 0.000 | 0.361 |
0.033 0.000 | 0.405 |
0.262 0.000 | 0.402 |
0.405 0.199 | 0.480 |
0.010 0.000 | 0.106 |
||
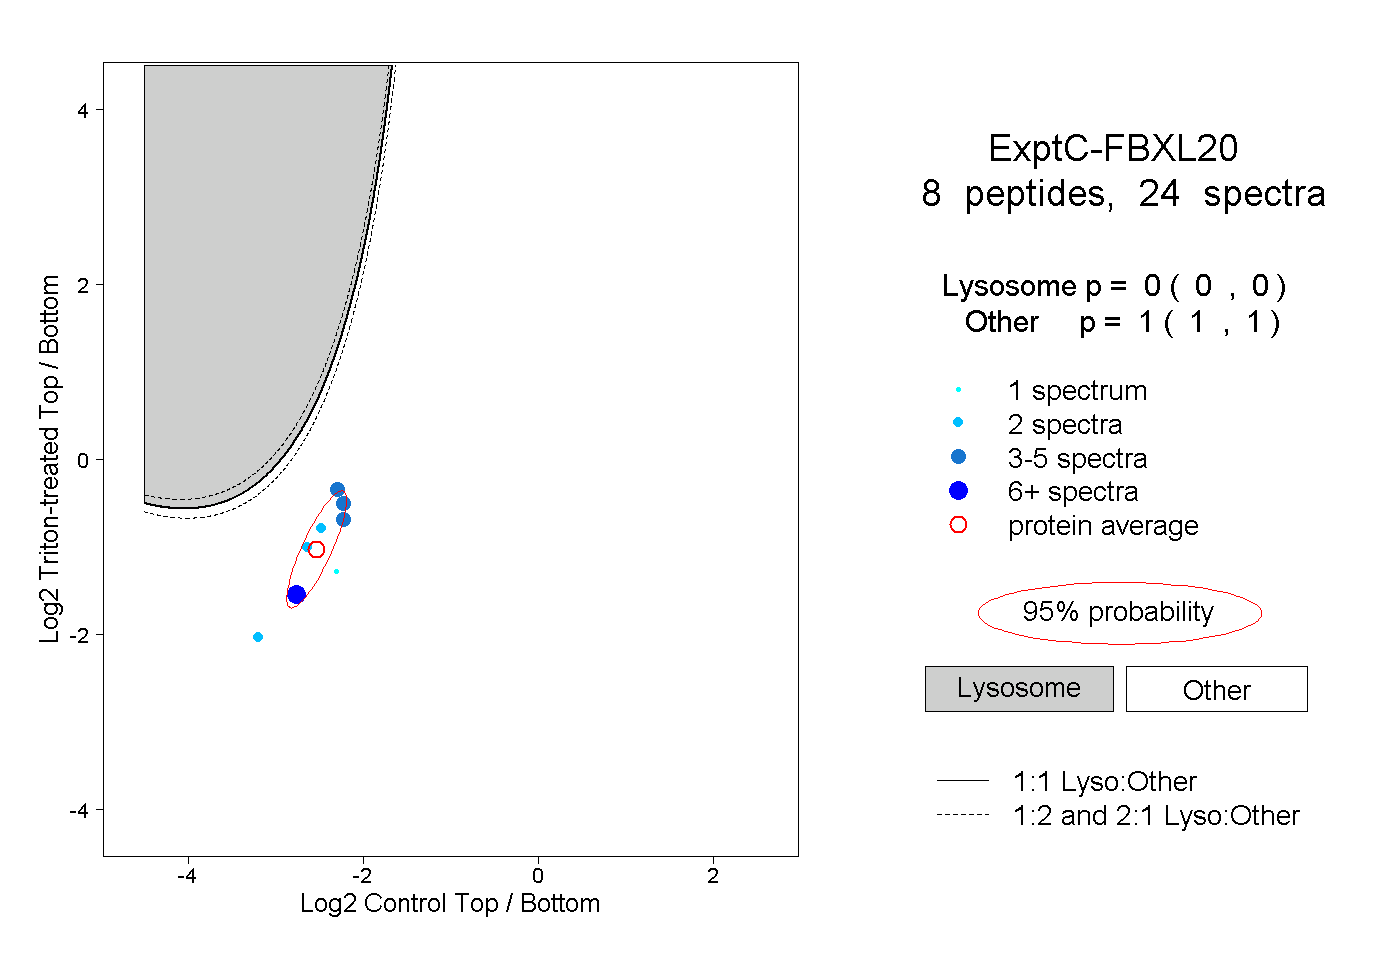
| Plot | Lyso | Other | |||||||||||
| Expt C |
8 peptides |
24 spectra |
|
0.000 0.000 | 0.000 |
1.000 1.000 | 1.000 |