 5
5peptides
spectra
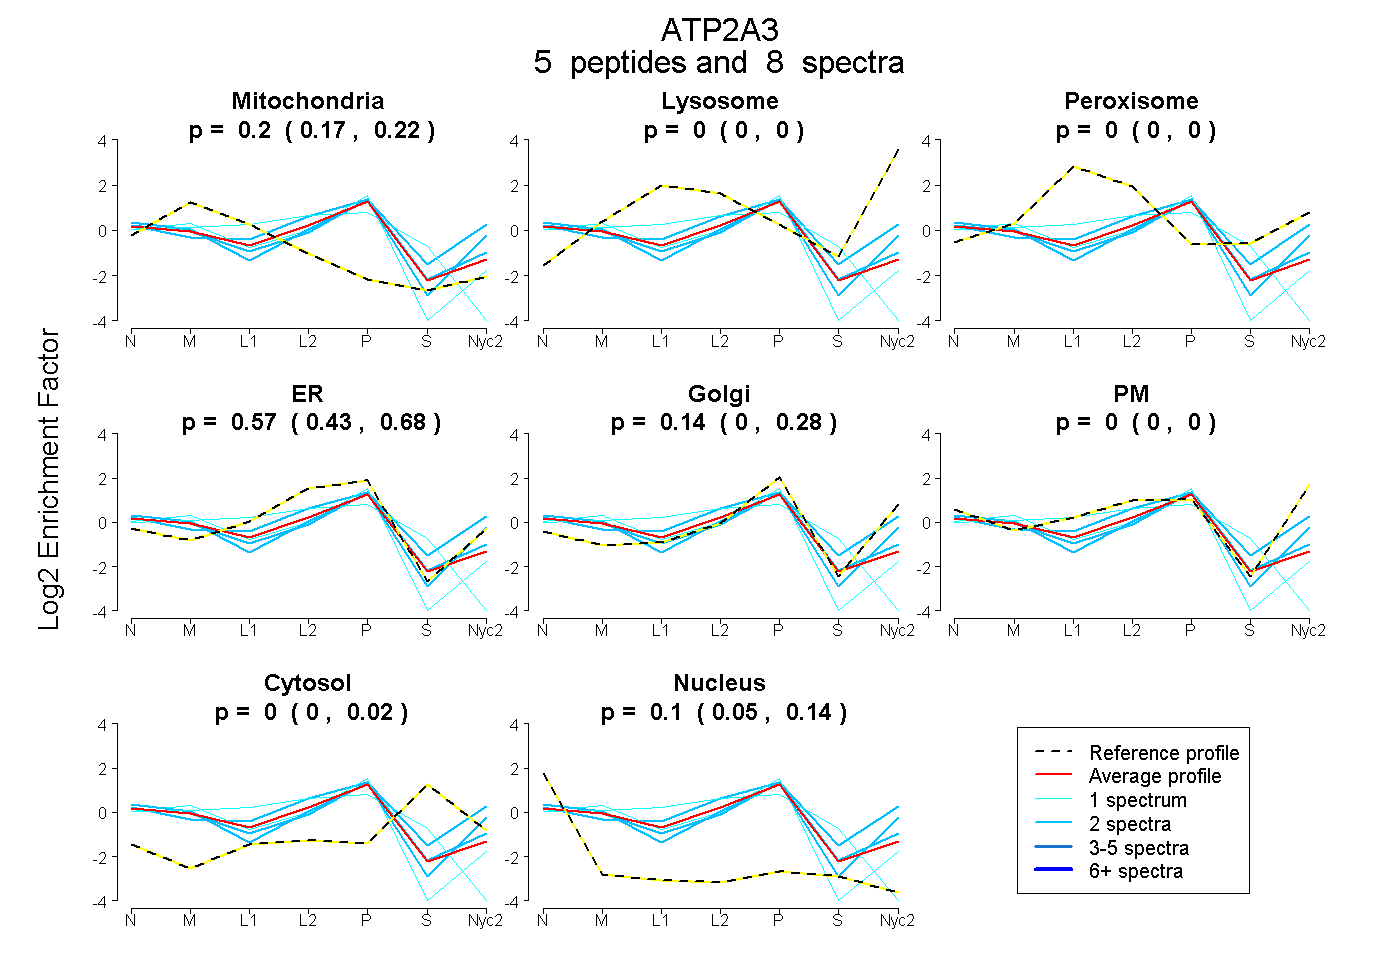
0.173 | 0.218
0.000 | 0.000
0.000 | 0.000
0.431 | 0.677
0.000 | 0.281
0.000 | 0.000
0.000 | 0.025
0.053 | 0.136
4peptides
spectra
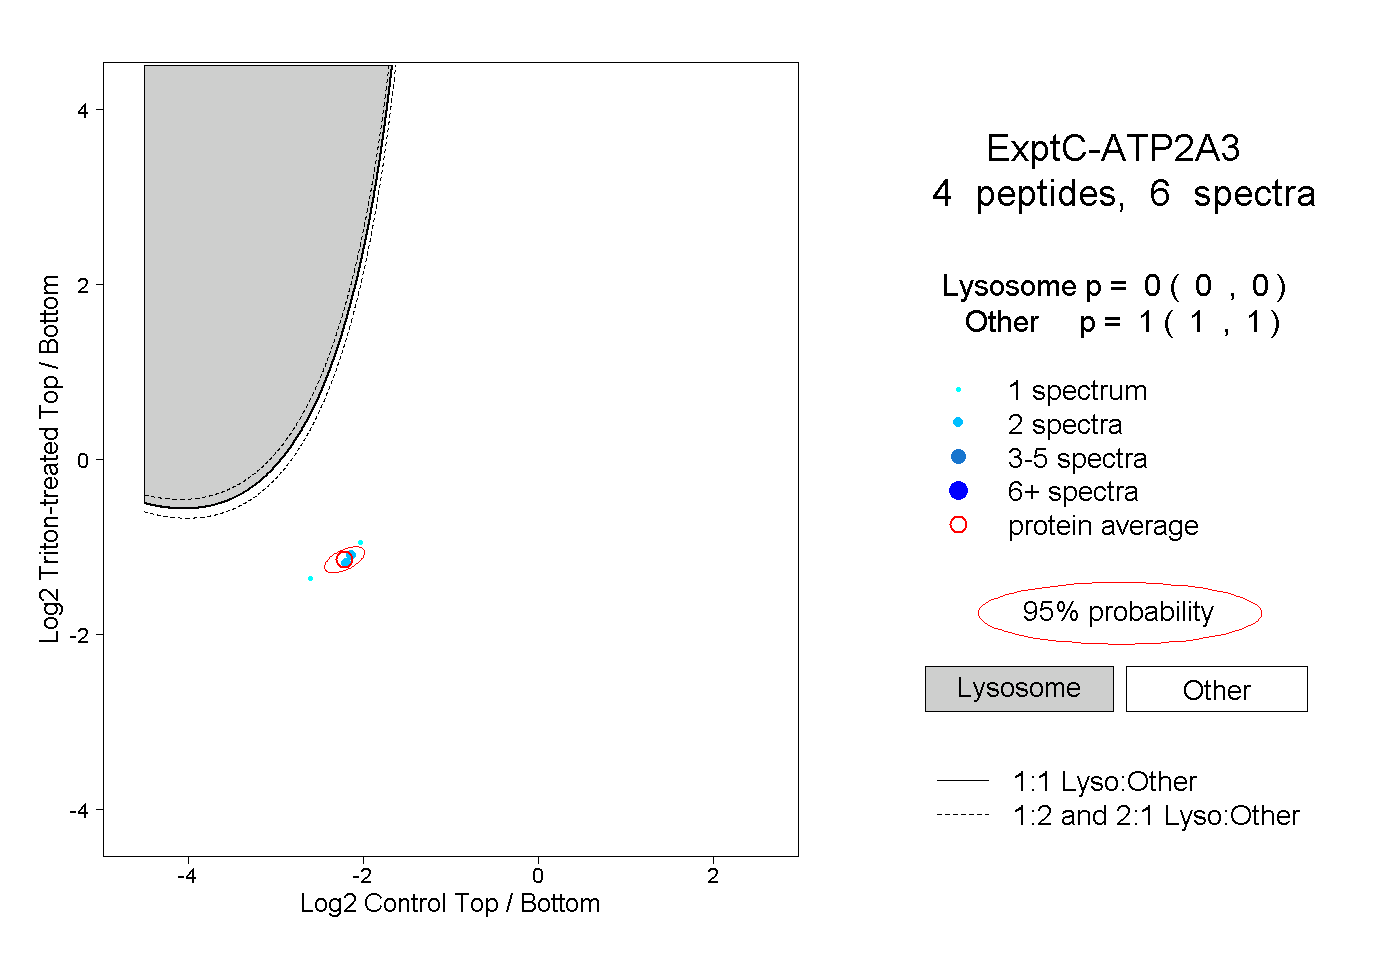
0.000 | 0.000
1.000 | 1.000
2peptides
spectra
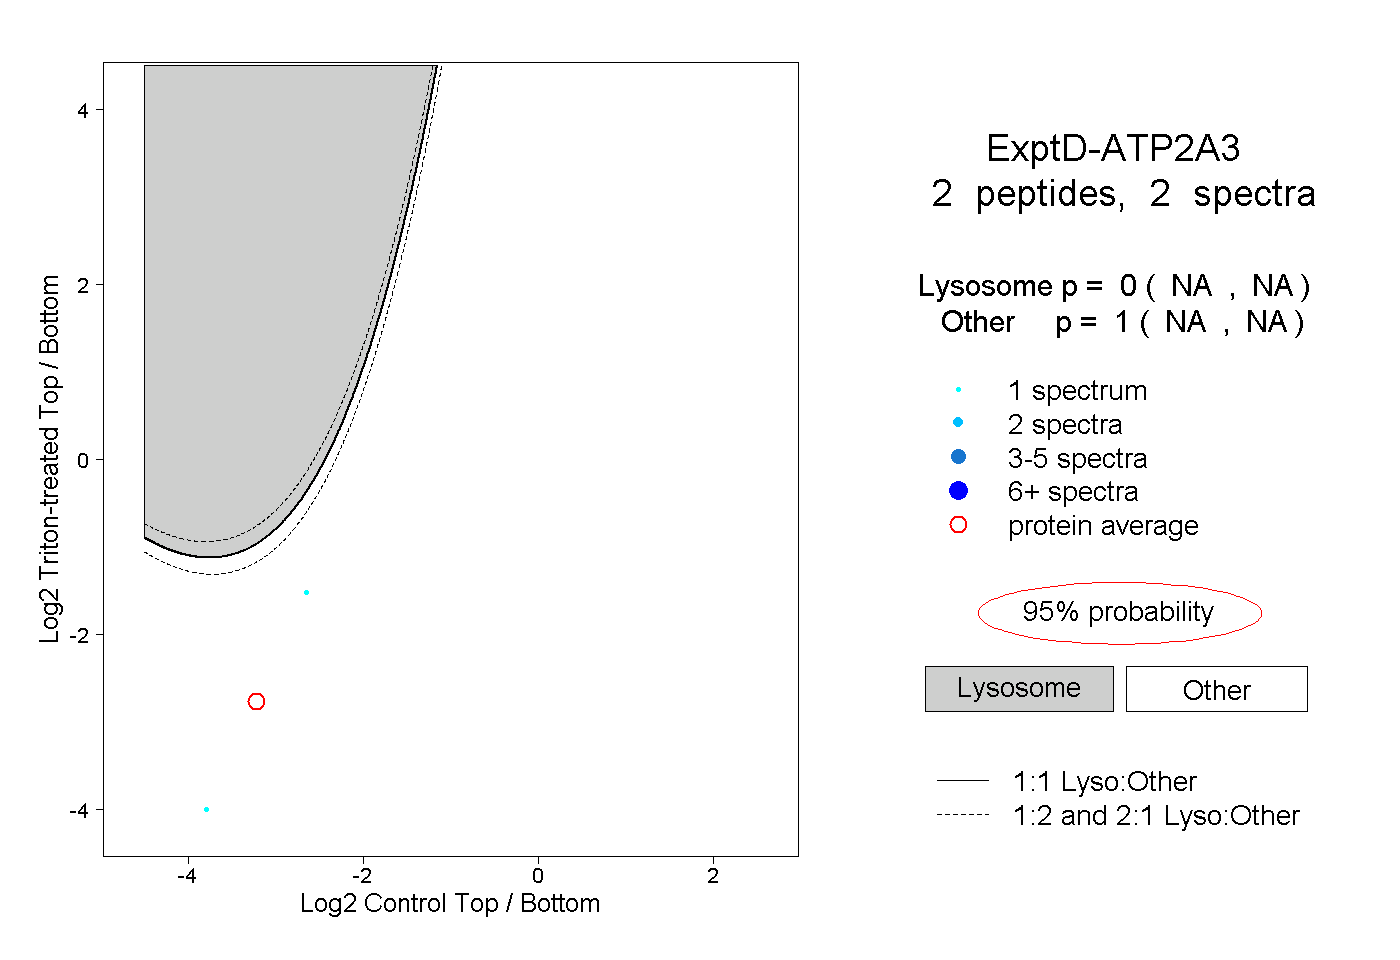
NA | NA
NA | NA