 2
2peptides
spectra
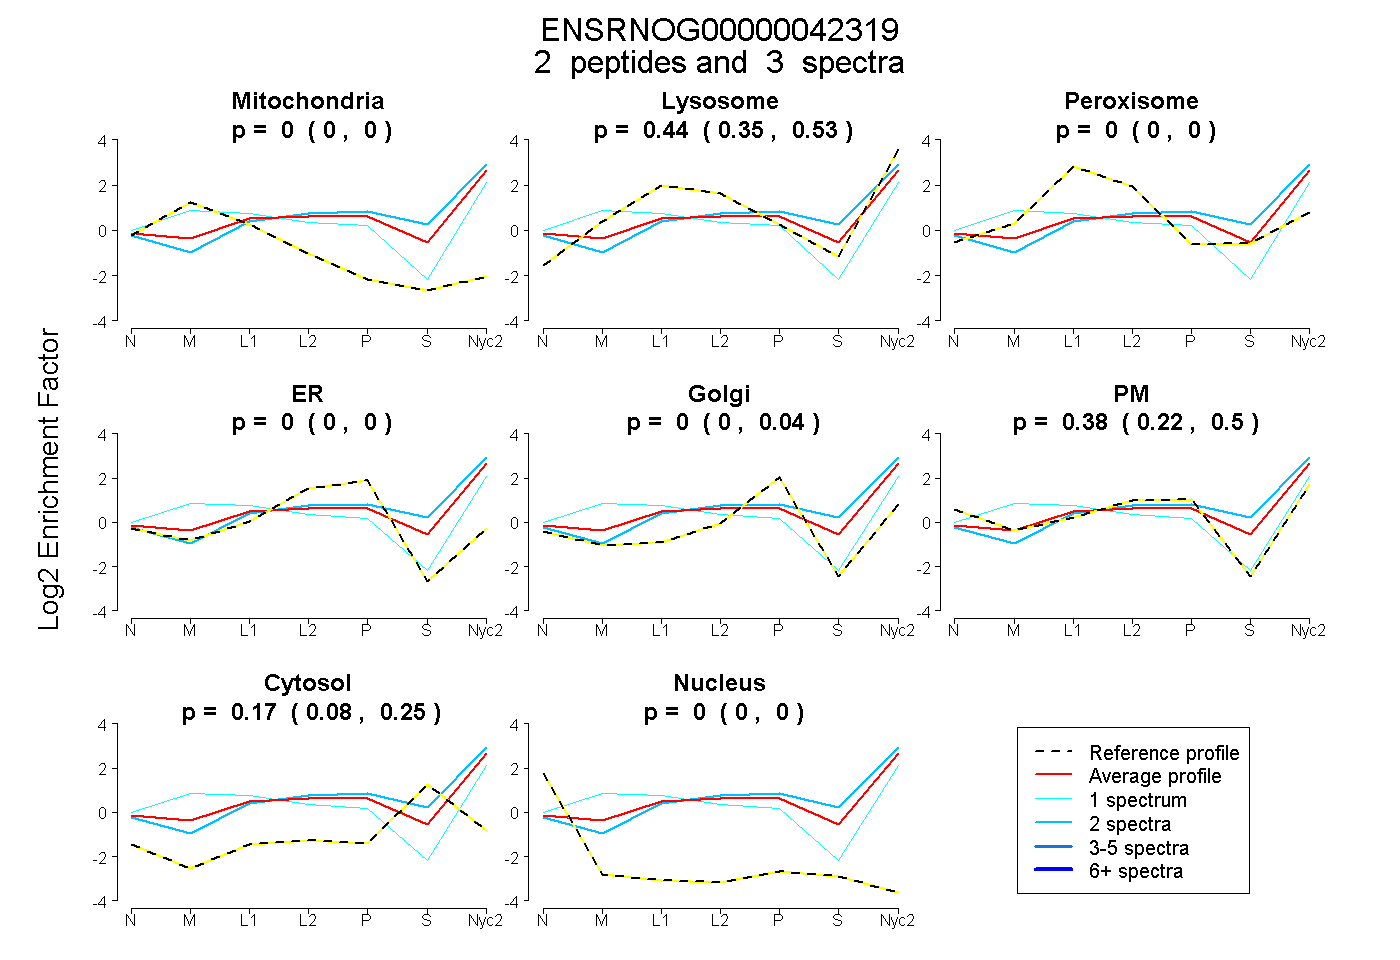
0.000 | 0.000
0.354 | 0.531
0.000 | 0.000
0.000 | 0.000
0.000 | 0.039
0.216 | 0.501
0.080 | 0.250
0.000 | 0.000
1peptide
spectra

NA | NA
NA | NA
NA | NA
NA | NA
NA | NA
NA | NA
NA | NA
2peptides
spectra
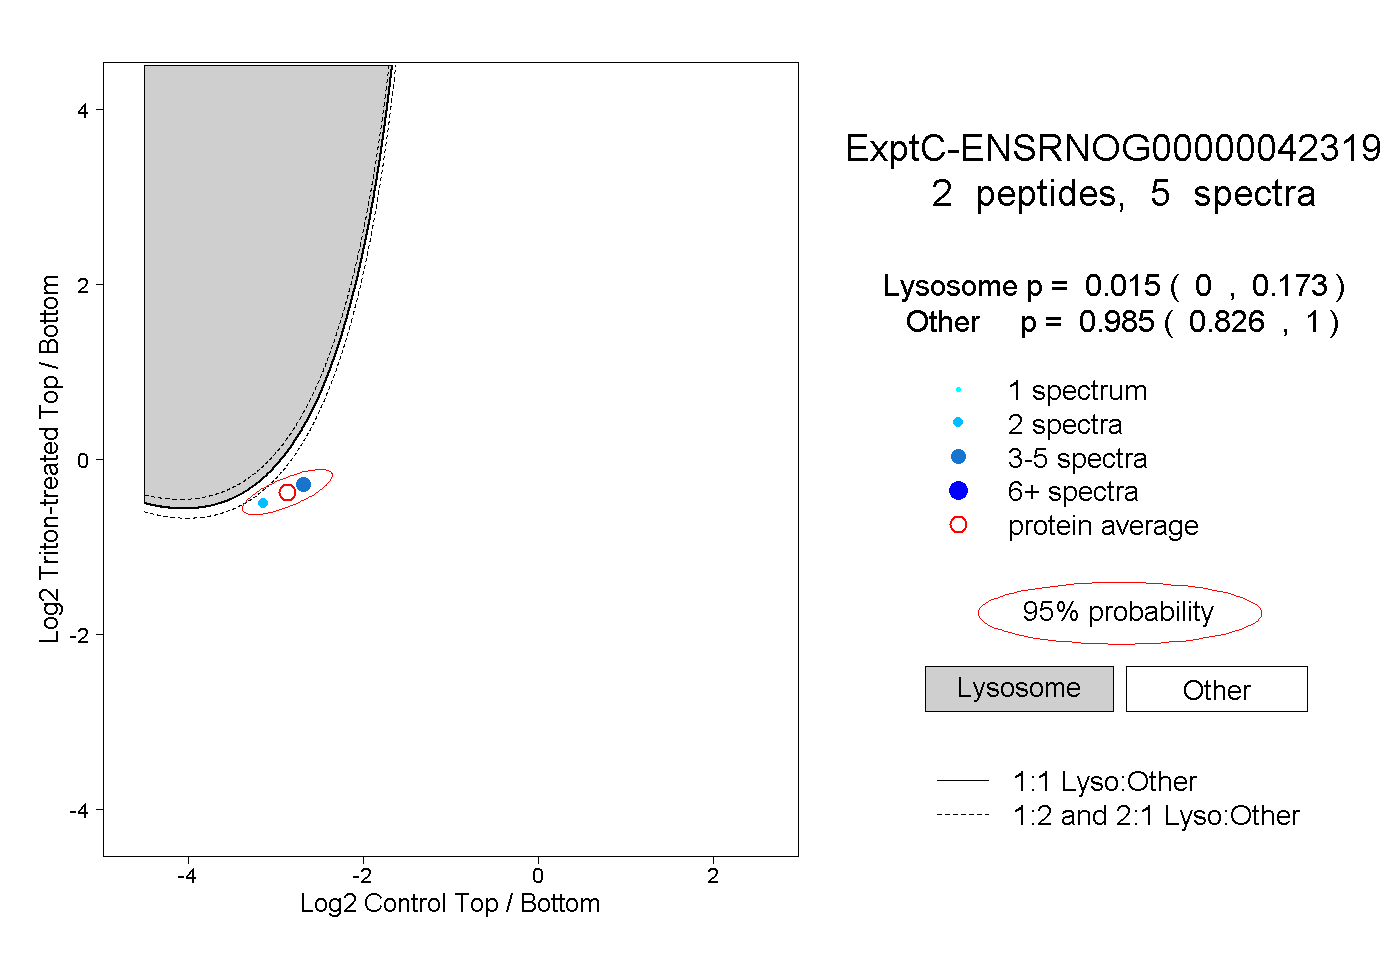
0.000 | 0.173
0.826 | 1.000
1peptide
spectrum
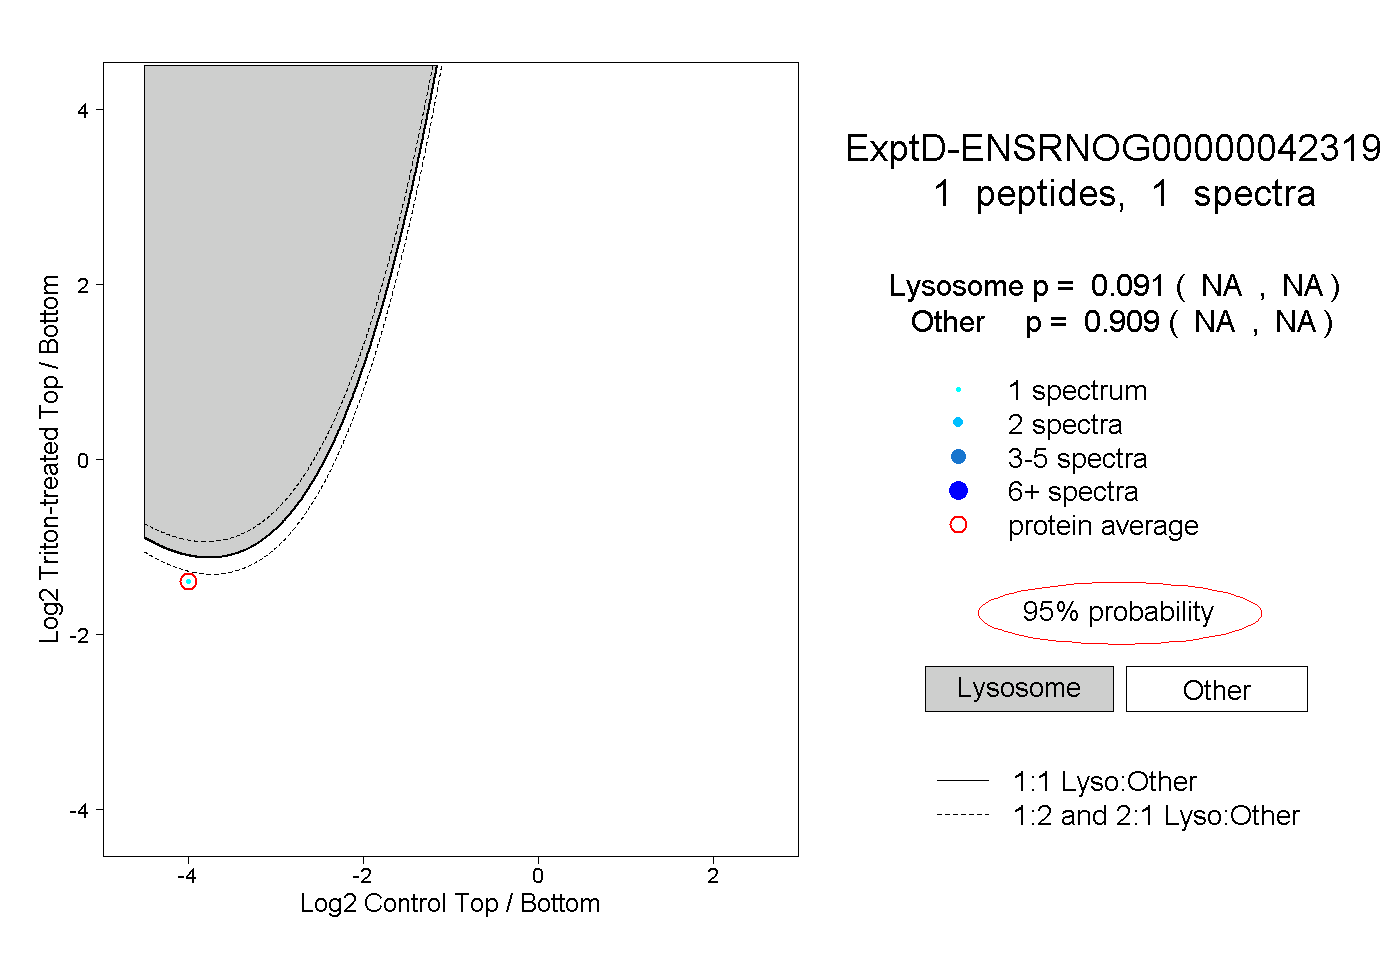
NA | NA
NA | NA