 10
10peptides
spectra
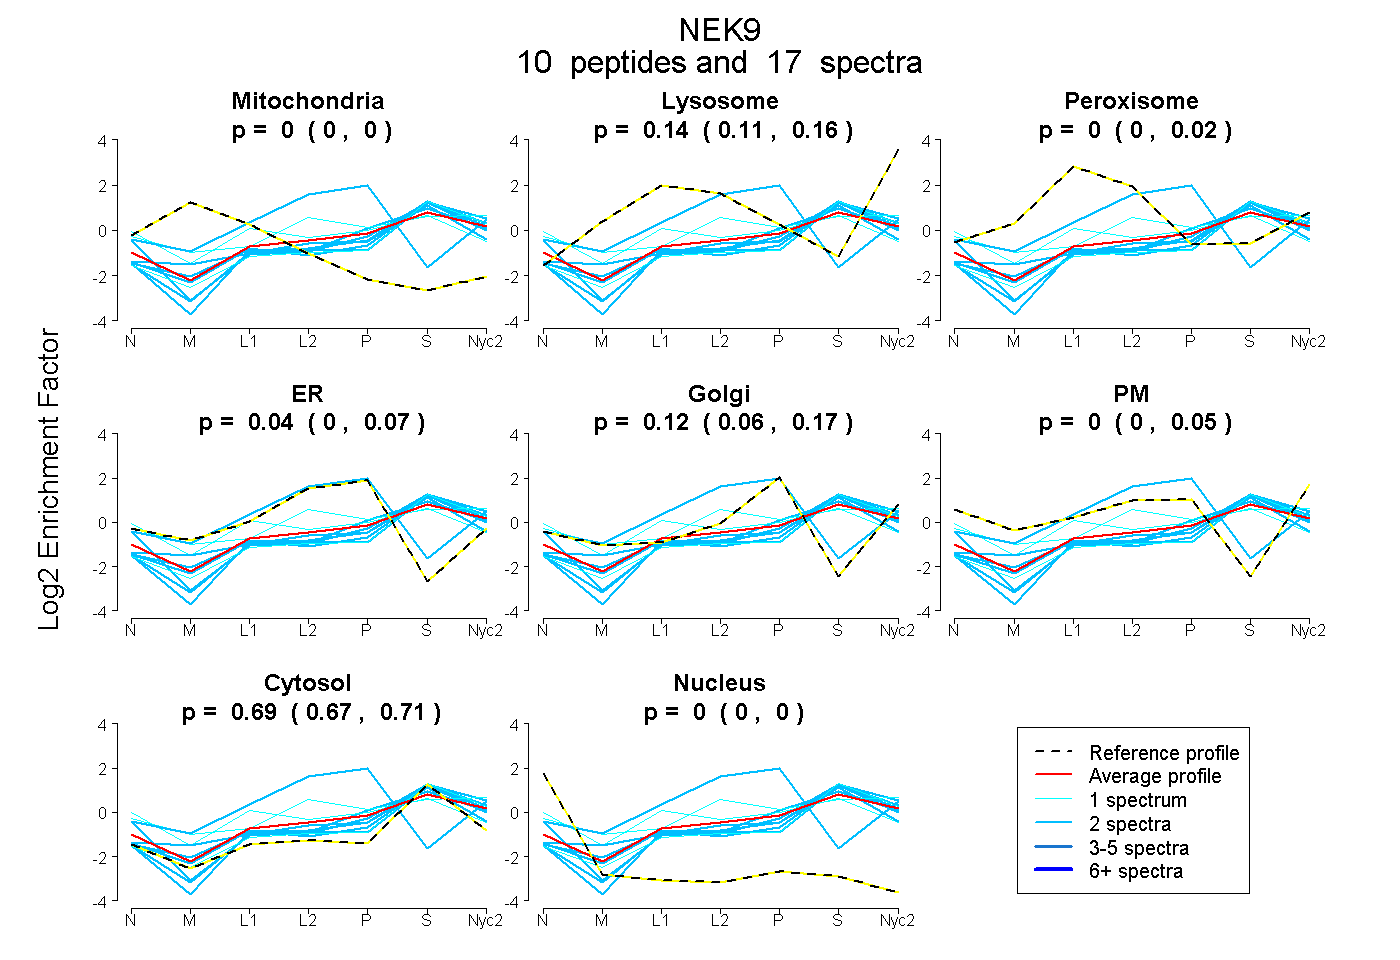
0.000 | 0.000
0.112 | 0.155
0.000 | 0.025
0.000 | 0.074
0.061 | 0.173
0.000 | 0.055
0.670 | 0.711
0.000 | 0.000
2peptides
spectra
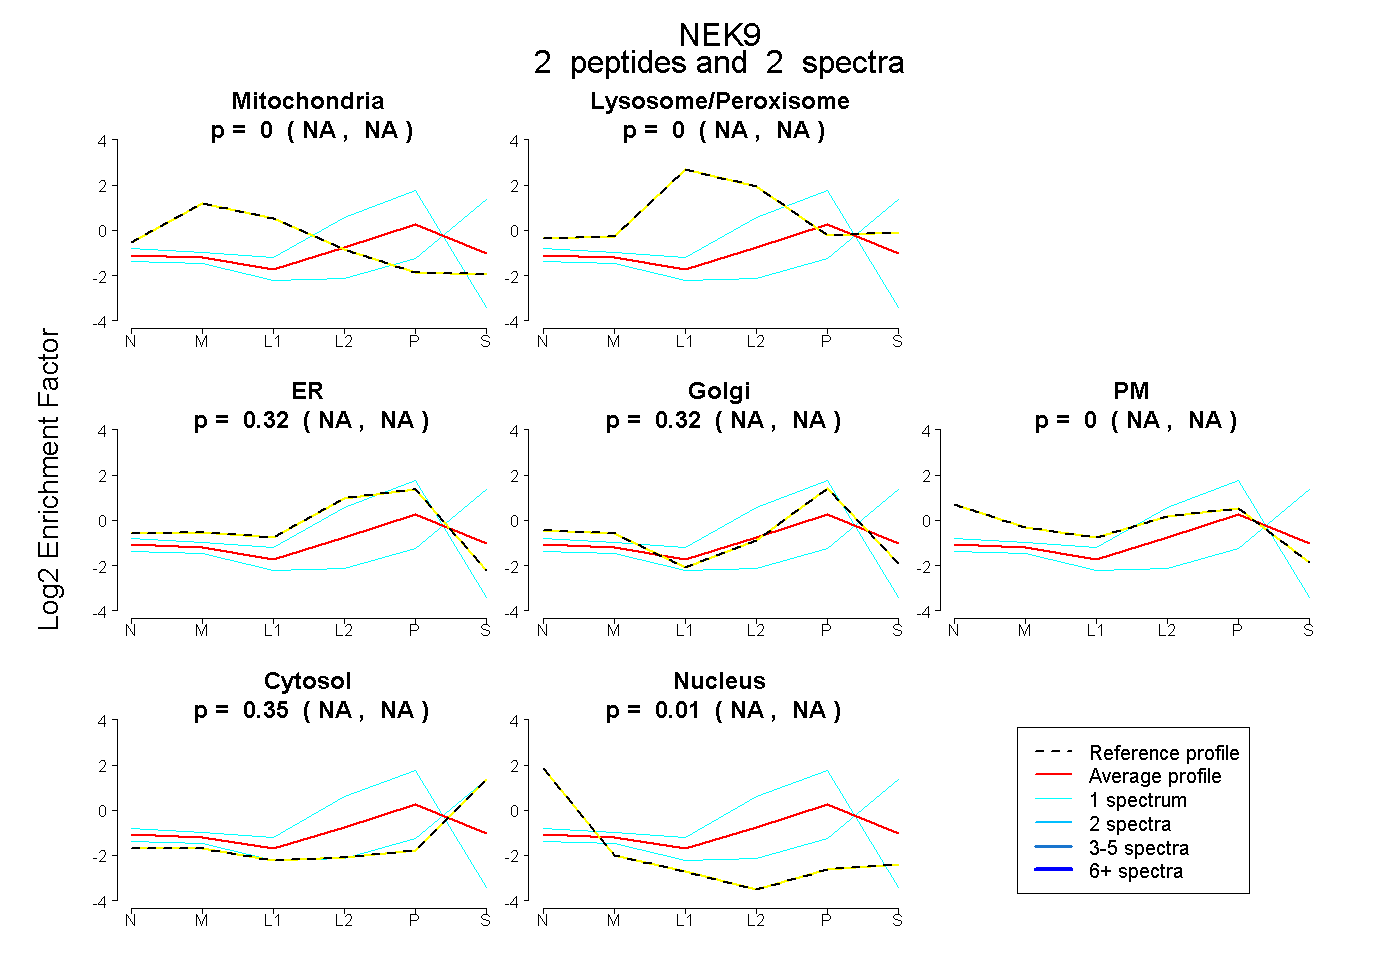
NA | NA
NA | NA
NA | NA
NA | NA
NA | NA
NA | NA
NA | NA
| Plot | Mito | Lyso | Perox | ER | Golgi | PM | Cytosol | Nucleus | |||||
| Expt A |
10 peptides |
17 spectra |
|
0.000 0.000 | 0.000 |
0.144 0.112 | 0.155 |
0.000 0.000 | 0.025 |
0.039 0.000 | 0.074 |
0.122 0.061 | 0.173 |
0.001 0.000 | 0.055 |
0.694 0.670 | 0.711 |
0.000 0.000 | 0.000 |
||
| Plot | Mito | Lyso or Perox | ER | Golgi | PM | Cytosol | Nucleus | ||||||
| Expt B |
2 peptides |
2 spectra |
|
0.000 NA | NA |
0.000 NA | NA |
0.315 NA | NA |
0.324 NA | NA |
0.000 NA | NA |
0.347 NA | NA |
0.013 NA | NA |
| 1 spectrum, RPTADALLDLPLLR | 0.000 | 0.000 | 0.000 | 0.090 | 0.000 | 0.910 | 0.000 | |||
| 1 spectrum, IVQGIR | 0.000 | 0.000 | 0.814 | 0.186 | 0.000 | 0.000 | 0.000 |
| Plot | Lyso | Other | |||||||||||
| Expt C |
10 peptides |
15 spectra |
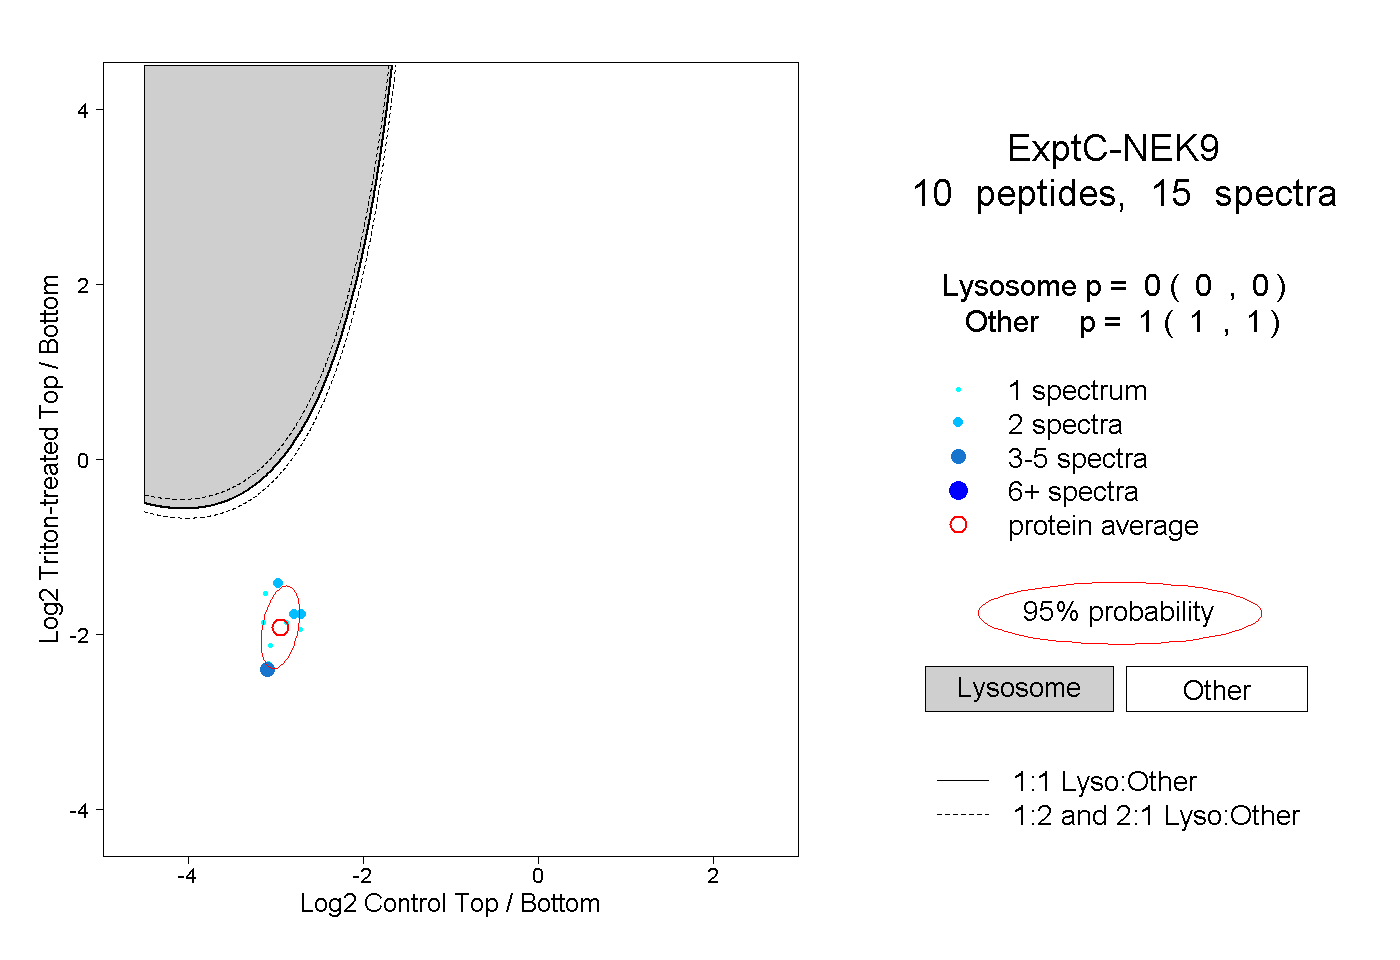 |
0.000 0.000 | 0.000 |
1.000 1.000 | 1.000 |
||||||||
| Plot | Lyso | Other | |||||||||||
| Expt D |
1 peptide |
2 spectra |
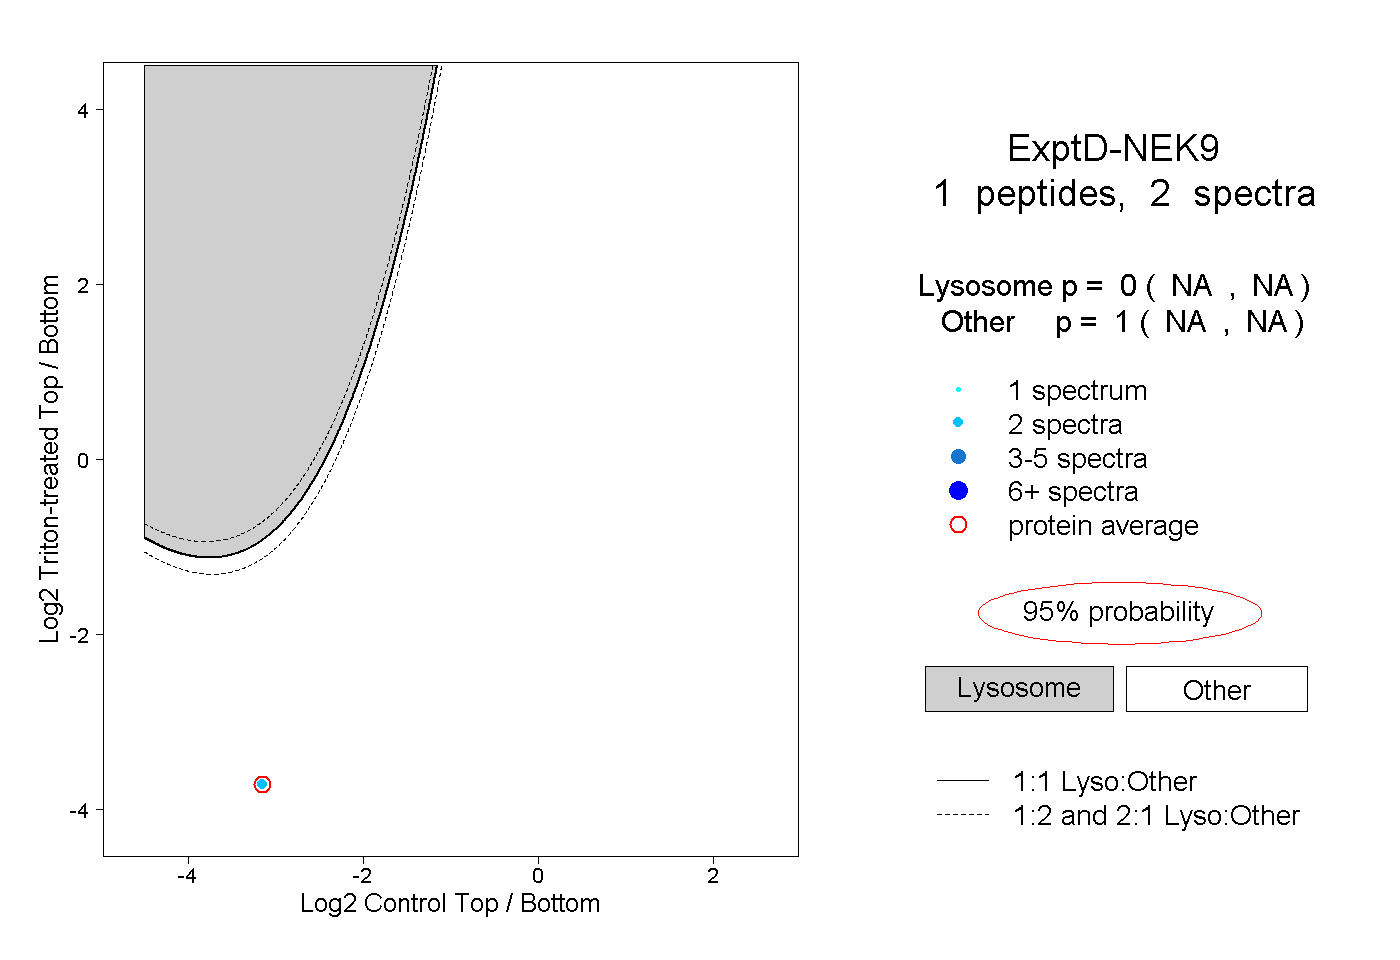 |
0.000 NA | NA |
1.000 NA | NA |