 2
2peptides
spectra

0.377 | 0.618
0.000 | 0.241
0.014 | 0.326
0.000 | 0.096
0.000 | 0.029
0.000 | 0.316
0.000 | 0.002
0.000 | 0.054
| Plot | Mito | Lyso | Perox | ER | Golgi | PM | Cytosol | Nucleus | |||||
| Expt A |
2 peptides |
3 spectra |
|
0.522 0.377 | 0.618 |
0.045 0.000 | 0.241 |
0.211 0.014 | 0.326 |
0.000 0.000 | 0.096 |
0.000 0.000 | 0.029 |
0.222 0.000 | 0.316 |
0.000 0.000 | 0.002 |
0.000 0.000 | 0.054 |
| 2 spectra, GLGLSFLR | 0.749 | 0.104 | 0.131 | 0.000 | 0.000 | 0.016 | 0.000 | 0.000 | ||
| 1 spectrum, APVTCTPGQPGQER | 0.046 | 0.000 | 0.303 | 0.000 | 0.000 | 0.575 | 0.076 | 0.000 |
| Plot | Lyso | Other | |||||||||||
| Expt C |
6 peptides |
14 spectra |
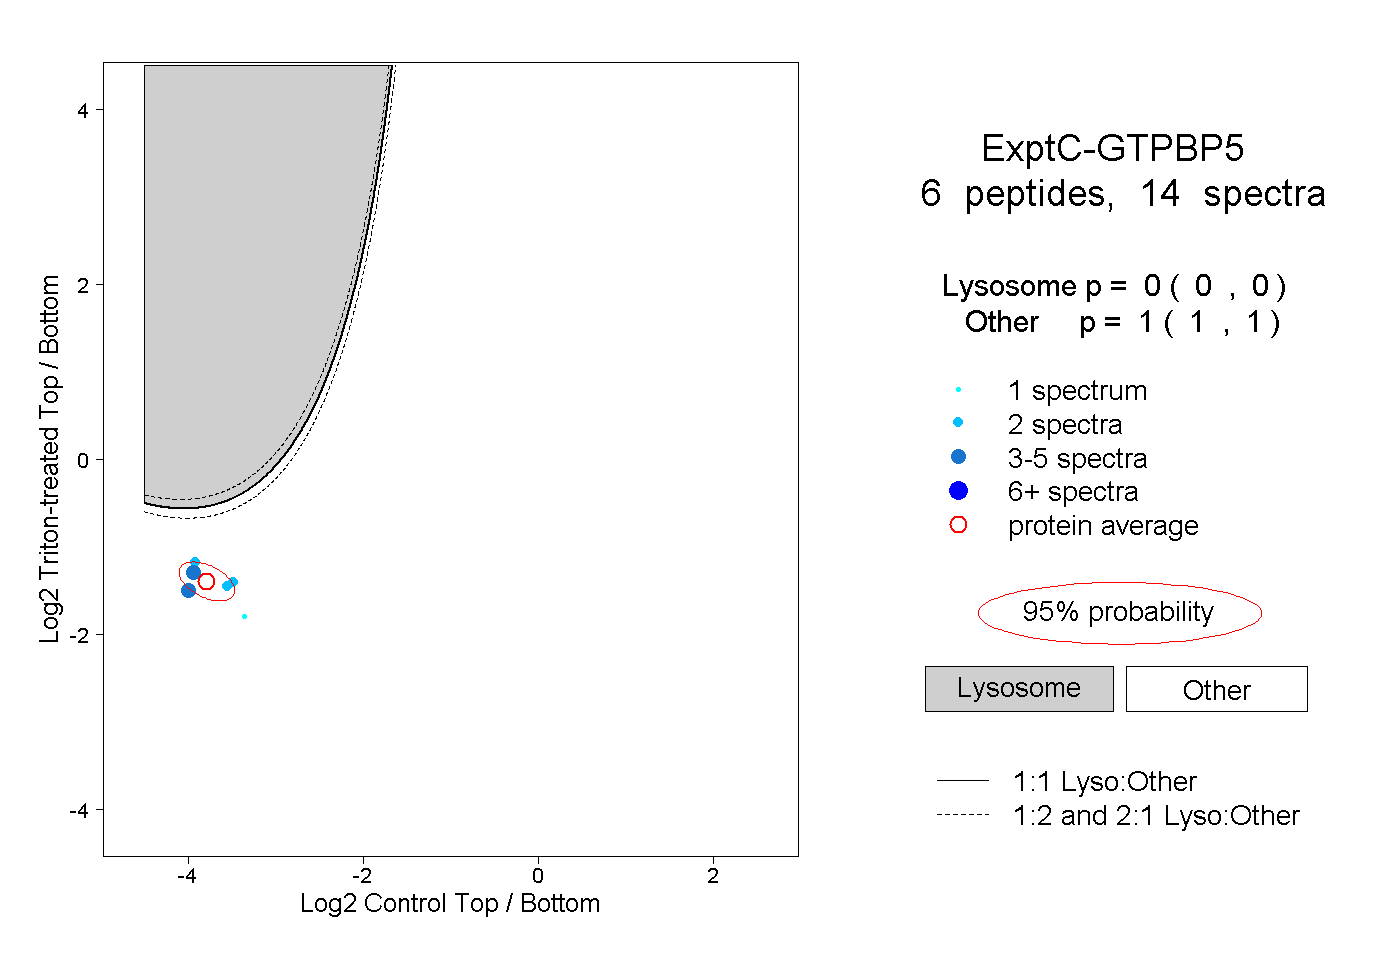 |
0.000 0.000 | 0.000 |
1.000 1.000 | 1.000 |