 11
11peptides
spectra
0.420 | 0.451
0.000 | 0.000
0.210 | 0.229
0.000 | 0.000
0.123 | 0.153
0.000 | 0.000
0.192 | 0.214
0.000 | 0.000
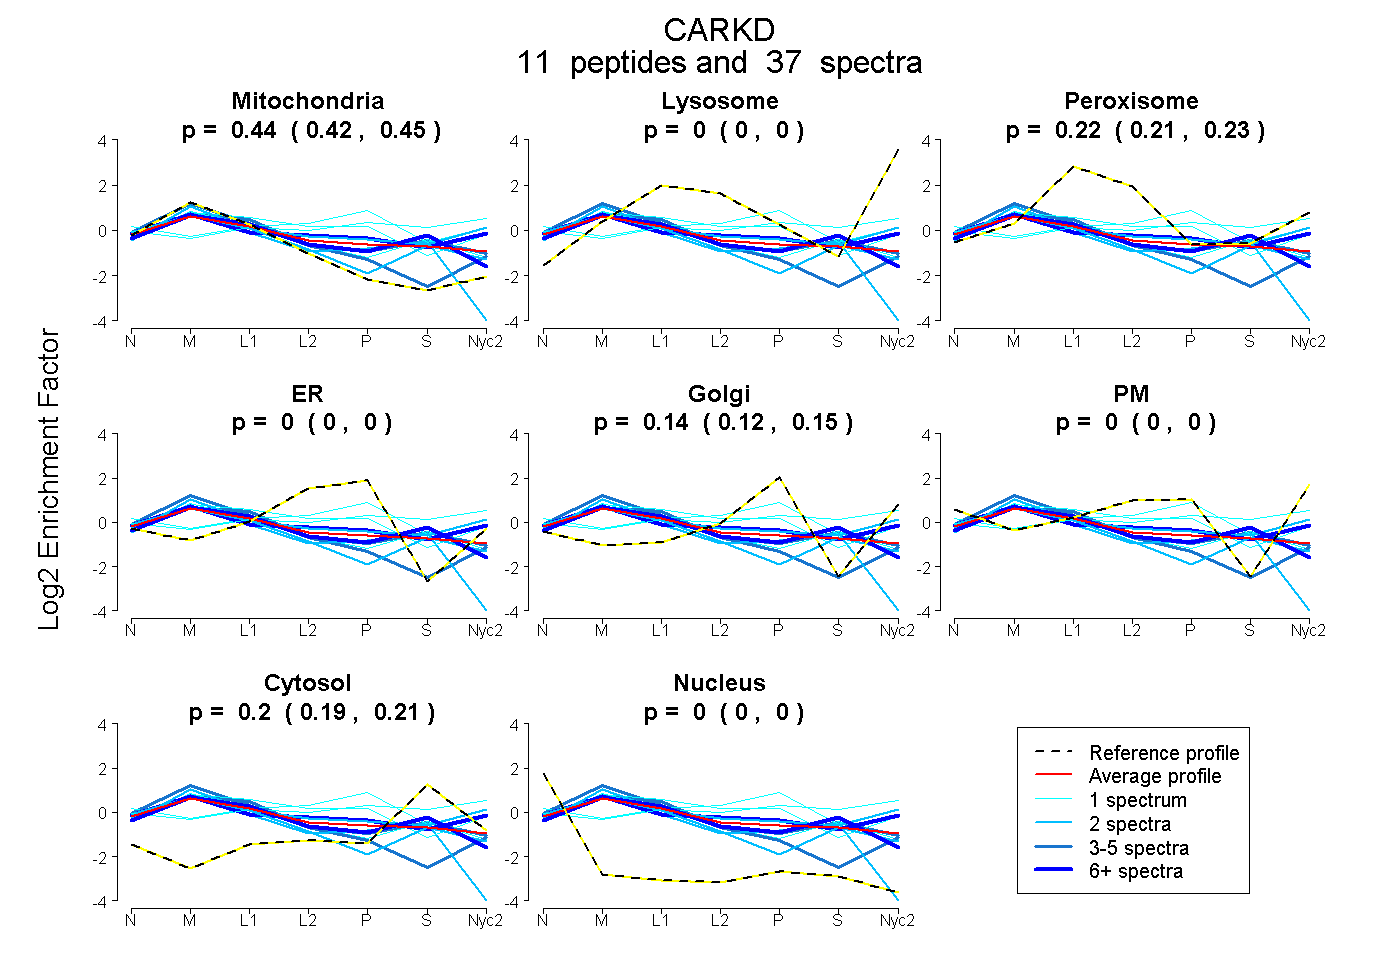
| Plot | Mito | Lyso | Perox | ER | Golgi | PM | Cytosol | Nucleus | |||||
| Expt A |
11 peptides |
37 spectra |
|
0.437 0.420 | 0.451 |
0.000 0.000 | 0.000 |
0.220 0.210 | 0.229 |
0.000 0.000 | 0.000 |
0.139 0.123 | 0.153 |
0.000 0.000 | 0.000 |
0.204 0.192 | 0.214 |
0.000 0.000 | 0.000 |
| 2 spectra, ECNHLAFQK | 0.720 | 0.000 | 0.000 | 0.004 | 0.000 | 0.000 | 0.253 | 0.023 | ||
| 2 spectra, LSQALGNITIVQK | 0.627 | 0.000 | 0.134 | 0.000 | 0.000 | 0.000 | 0.239 | 0.000 | ||
| 1 spectrum, GEQDLISNGQQVLVCNQEGSSR | 0.296 | 0.000 | 0.354 | 0.000 | 0.321 | 0.000 | 0.030 | 0.000 | ||
| 1 spectrum, STTTTDMIAEVGAAFSK | 0.000 | 0.000 | 0.262 | 0.000 | 0.086 | 0.291 | 0.360 | 0.000 | ||
| 1 spectrum, DDLLLNNVR | 0.511 | 0.000 | 0.219 | 0.000 | 0.000 | 0.000 | 0.270 | 0.000 | ||
| 4 spectra, AVLTPNHVEFSR | 0.467 | 0.000 | 0.263 | 0.000 | 0.029 | 0.000 | 0.241 | 0.000 | ||
| 1 spectrum, IGIVGGCQEYTGAPYFAGISALK | 0.031 | 0.000 | 0.273 | 0.064 | 0.317 | 0.122 | 0.194 | 0.000 | ||
| 11 spectra, VGADLTHVFCAR | 0.487 | 0.000 | 0.212 | 0.000 | 0.000 | 0.000 | 0.301 | 0.000 | ||
| 2 spectra, NIVPALTSK | 0.325 | 0.127 | 0.085 | 0.000 | 0.000 | 0.234 | 0.229 | 0.000 | ||
| 5 spectra, DMDNLFQLVR | 0.777 | 0.033 | 0.000 | 0.000 | 0.015 | 0.175 | 0.000 | 0.000 | ||
| 7 spectra, LHALVVGPGLGR | 0.355 | 0.075 | 0.101 | 0.000 | 0.062 | 0.204 | 0.203 | 0.000 |
| Plot | Mito | Lyso or Perox | ER | Golgi | PM | Cytosol | Nucleus | ||||||
| Expt B |
8 peptides |
17 spectra |
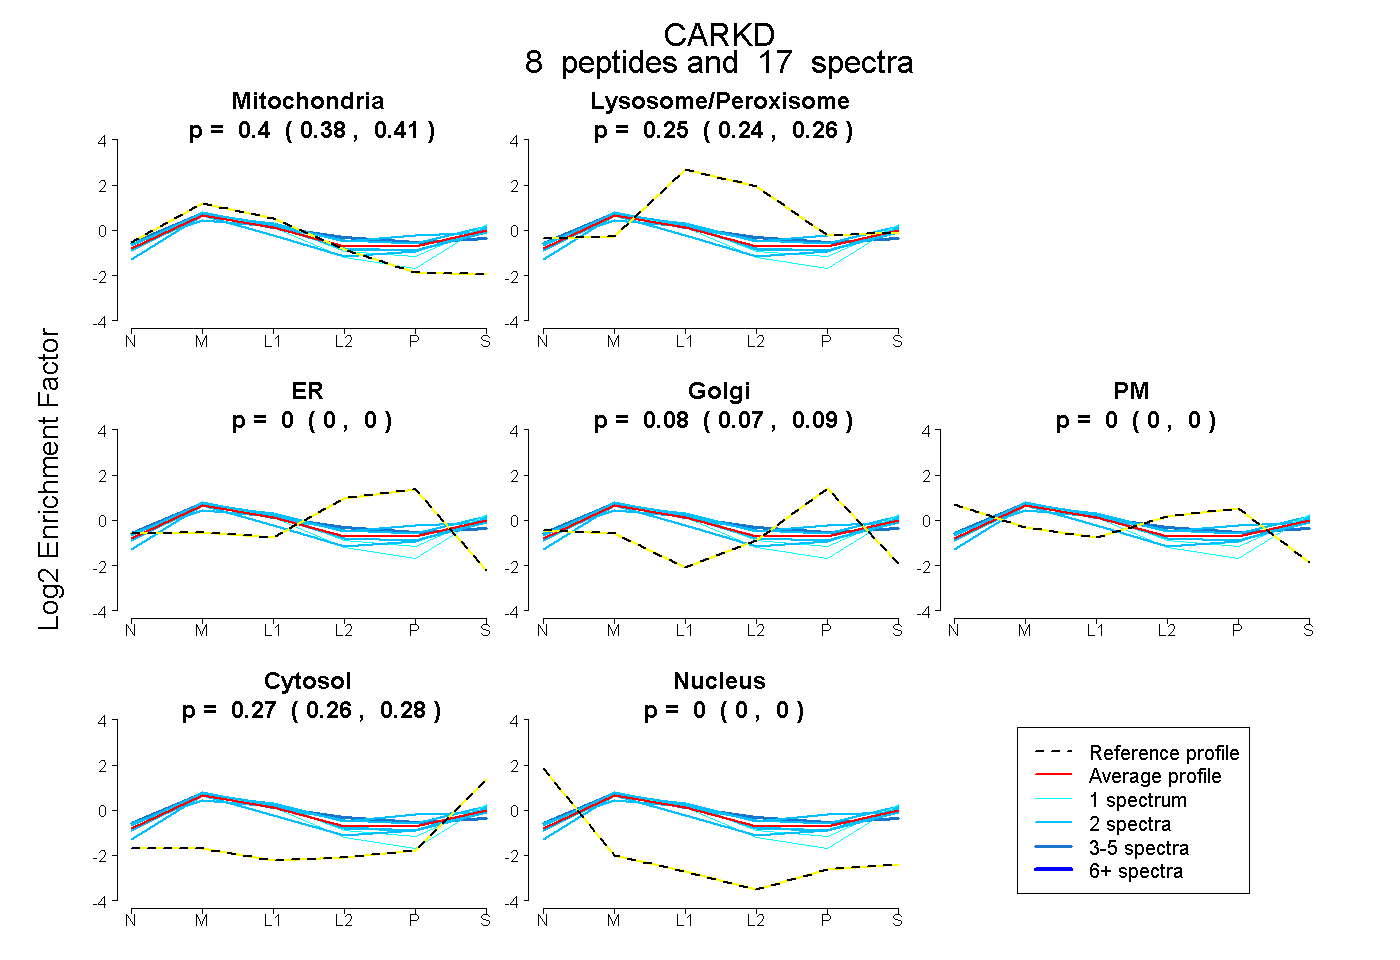 |
0.396 0.383 | 0.407 |
0.253 0.243 | 0.261 |
0.000 0.000 | 0.000 |
0.081 0.068 | 0.091 |
0.000 0.000 | 0.000 |
0.270 0.261 | 0.277 |
0.000 0.000 | 0.000 |
|||
| Plot | Lyso | Other | |||||||||||
| Expt C |
12 peptides |
81 spectra |
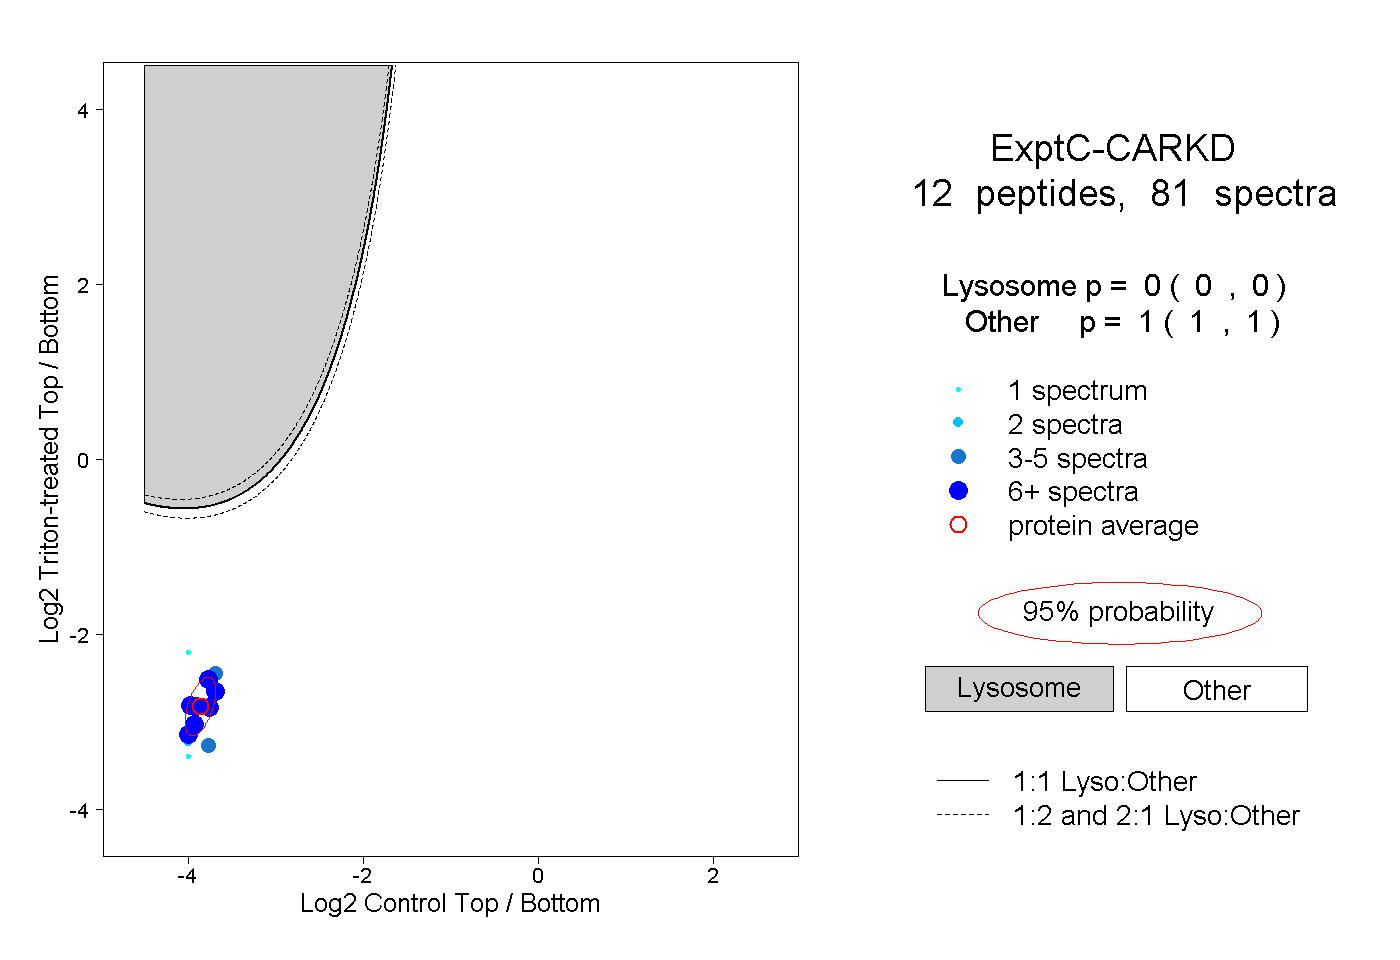 |
0.000 0.000 | 0.000 |
1.000 1.000 | 1.000 |
||||||||
| Plot | Lyso | Other | |||||||||||
| Expt D |
4 peptides |
7 spectra |
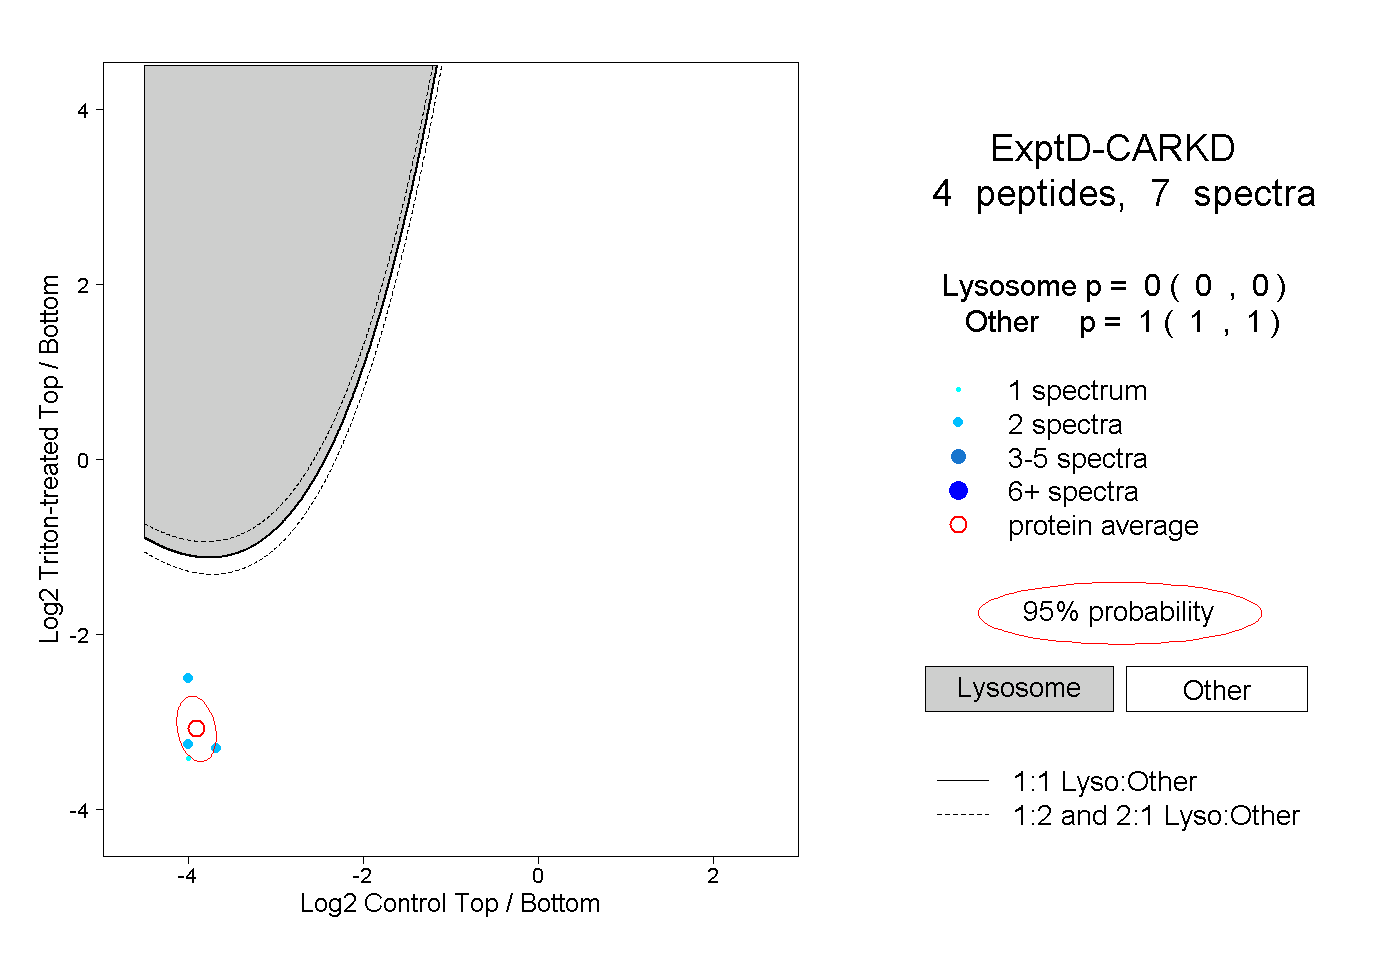 |
0.000 0.000 | 0.000 |
1.000 1.000 | 1.000 |