 4
4peptides
spectra
0.000 | 0.000
0.000 | 0.000
0.000 | 0.000
0.552 | 0.637
0.000 | 0.035
0.000 | 0.000
0.265 | 0.339
0.030 | 0.121
3peptides
spectra
0.000 | 0.000
1.000 | 1.000
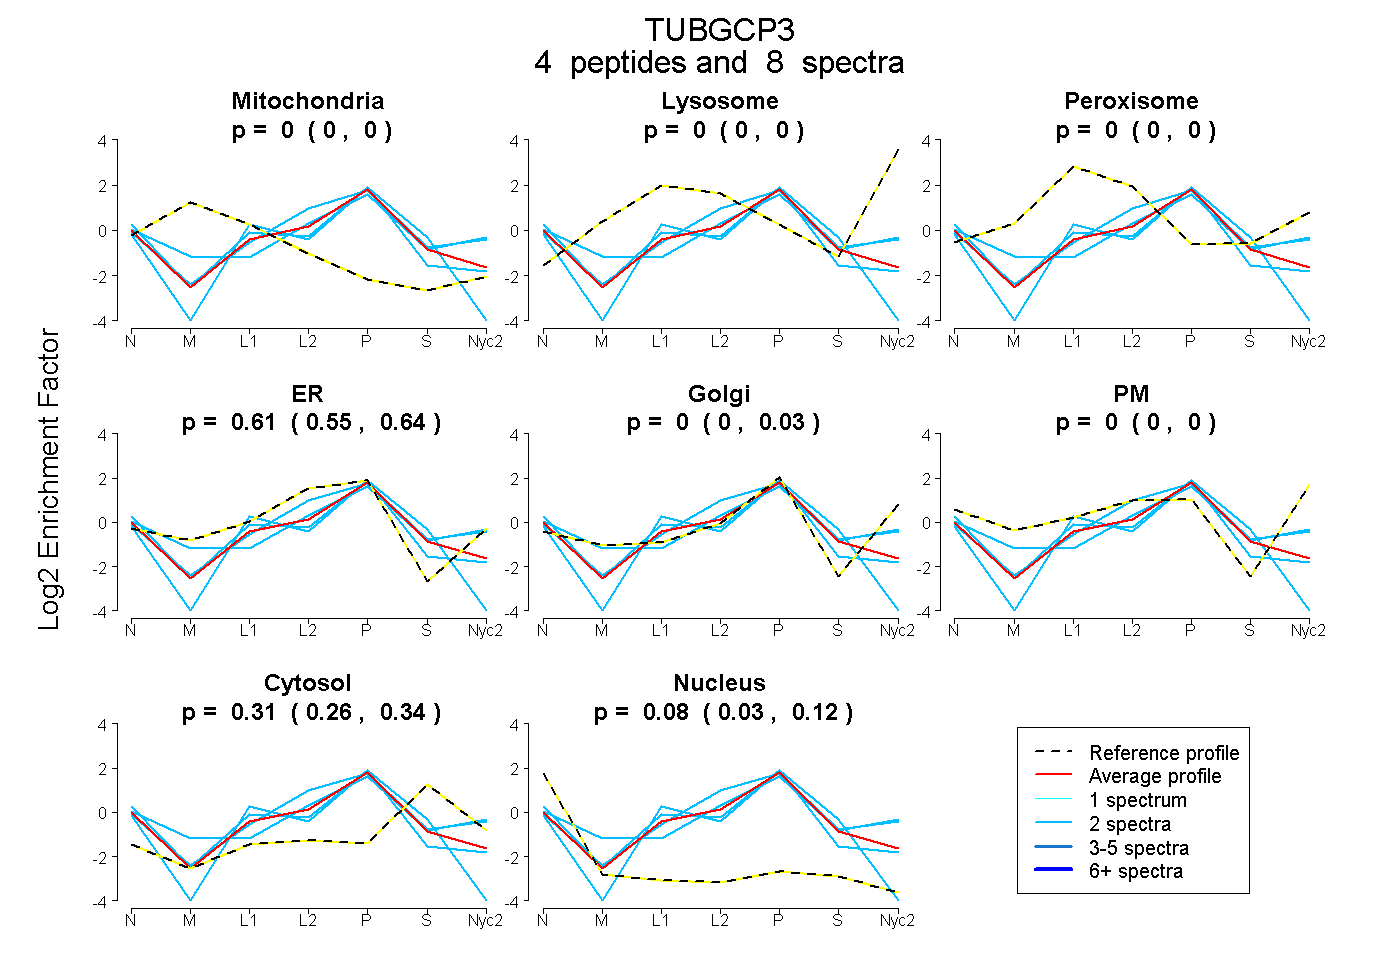
| Plot | Mito | Lyso | Perox | ER | Golgi | PM | Cytosol | Nucleus | |||||
| Expt A |
4 peptides |
8 spectra |
|
0.000 0.000 | 0.000 |
0.000 0.000 | 0.000 |
0.000 0.000 | 0.000 |
0.611 0.552 | 0.637 |
0.000 0.000 | 0.035 |
0.000 0.000 | 0.000 |
0.307 0.265 | 0.339 |
0.082 0.030 | 0.121 |
||
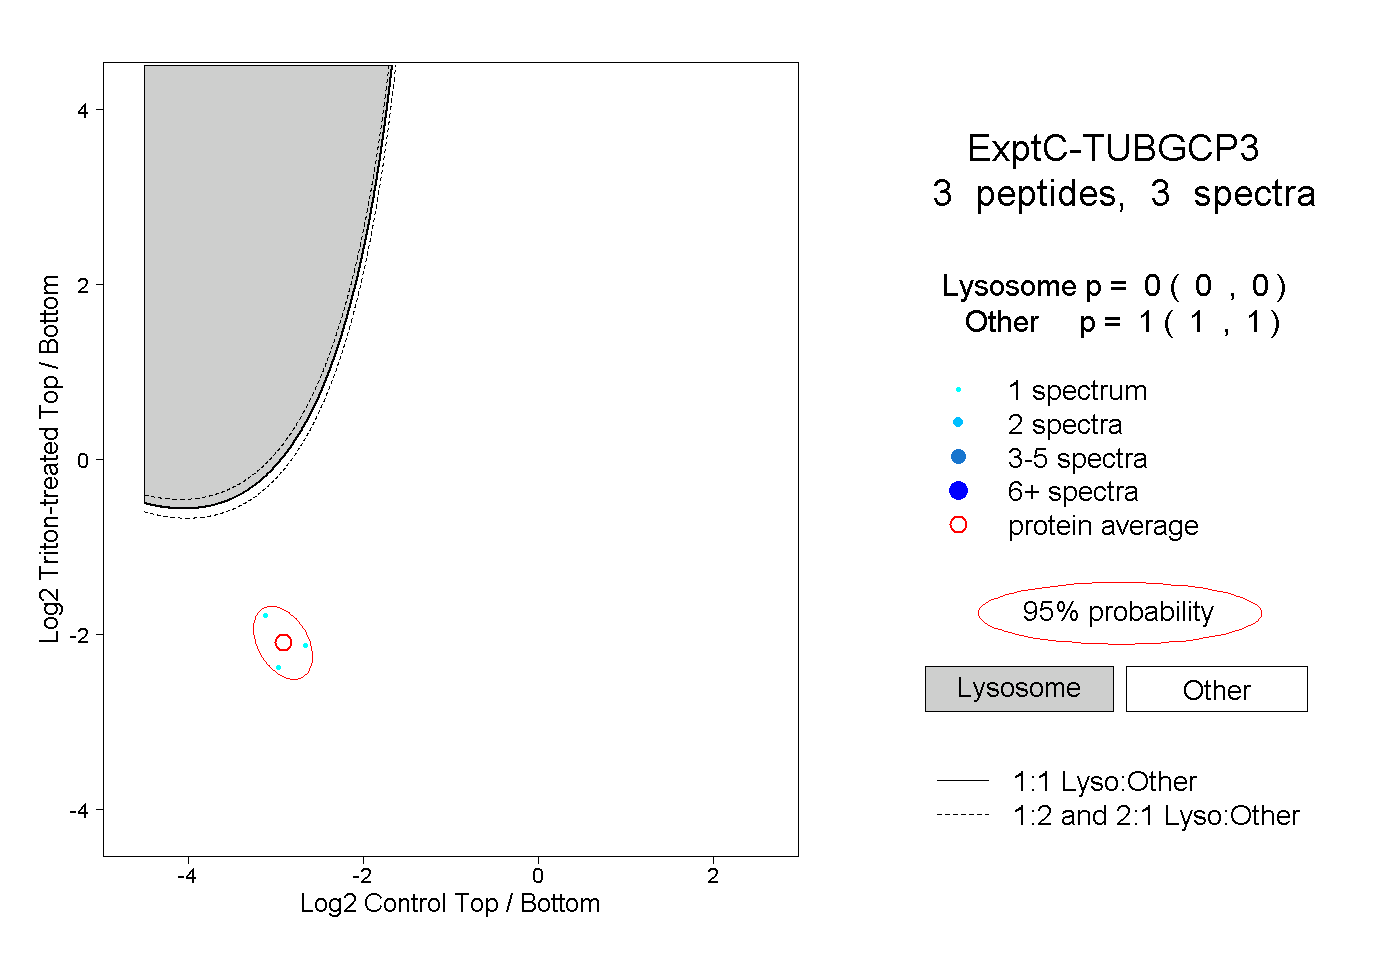
| Plot | Lyso | Other | |||||||||||
| Expt C |
3 peptides |
3 spectra |
|
0.000 0.000 | 0.000 |
1.000 1.000 | 1.000 |