MFN1
[ENSRNOP00000060265]
Main page
| | | Plot |
Mito |
Lyso |
|
Perox |
ER |
Golgi |
PM |
Cytosol |
Nucleus |
|
| Expt A |
 14
14
peptides |
31
spectra |
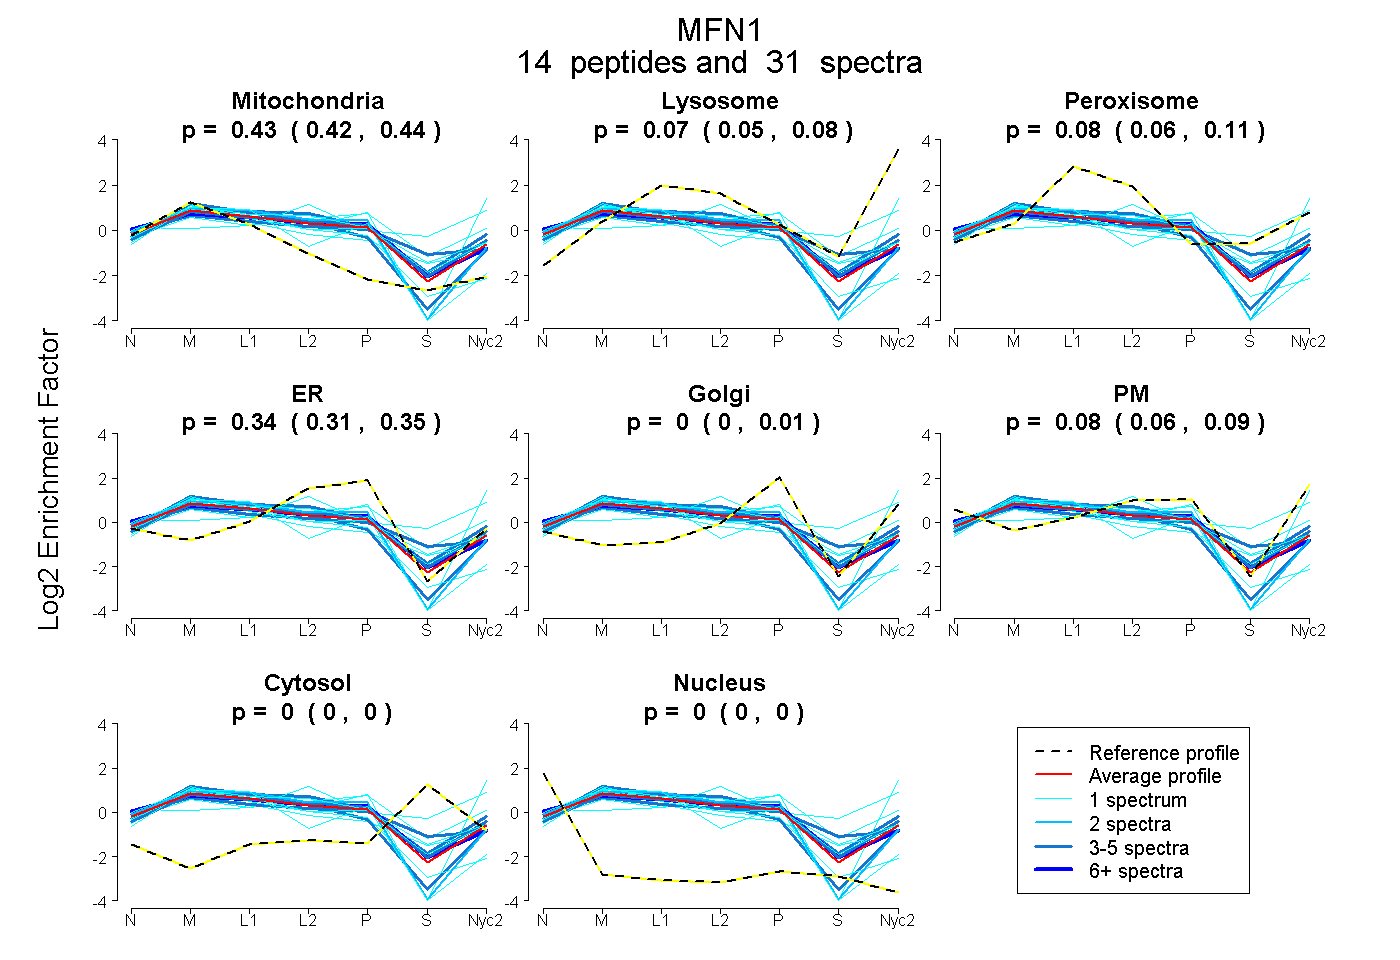 |
0.434
0.423 | 0.442 |
0.066
0.048 | 0.078 |
|
0.083
0.060 | 0.108 |
0.339
0.313 | 0.354 |
0.000
0.000 | 0.013 |
0.078
0.059 | 0.092 |
0.000
0.000 | 0.000 |
0.000
0.000 | 0.000 |
|
| | | Plot |
Mito |
|
Lyso or Perox |
|
ER |
Golgi |
PM |
Cytosol |
Nucleus |
|
| Expt B |
7
peptides |
11
spectra |
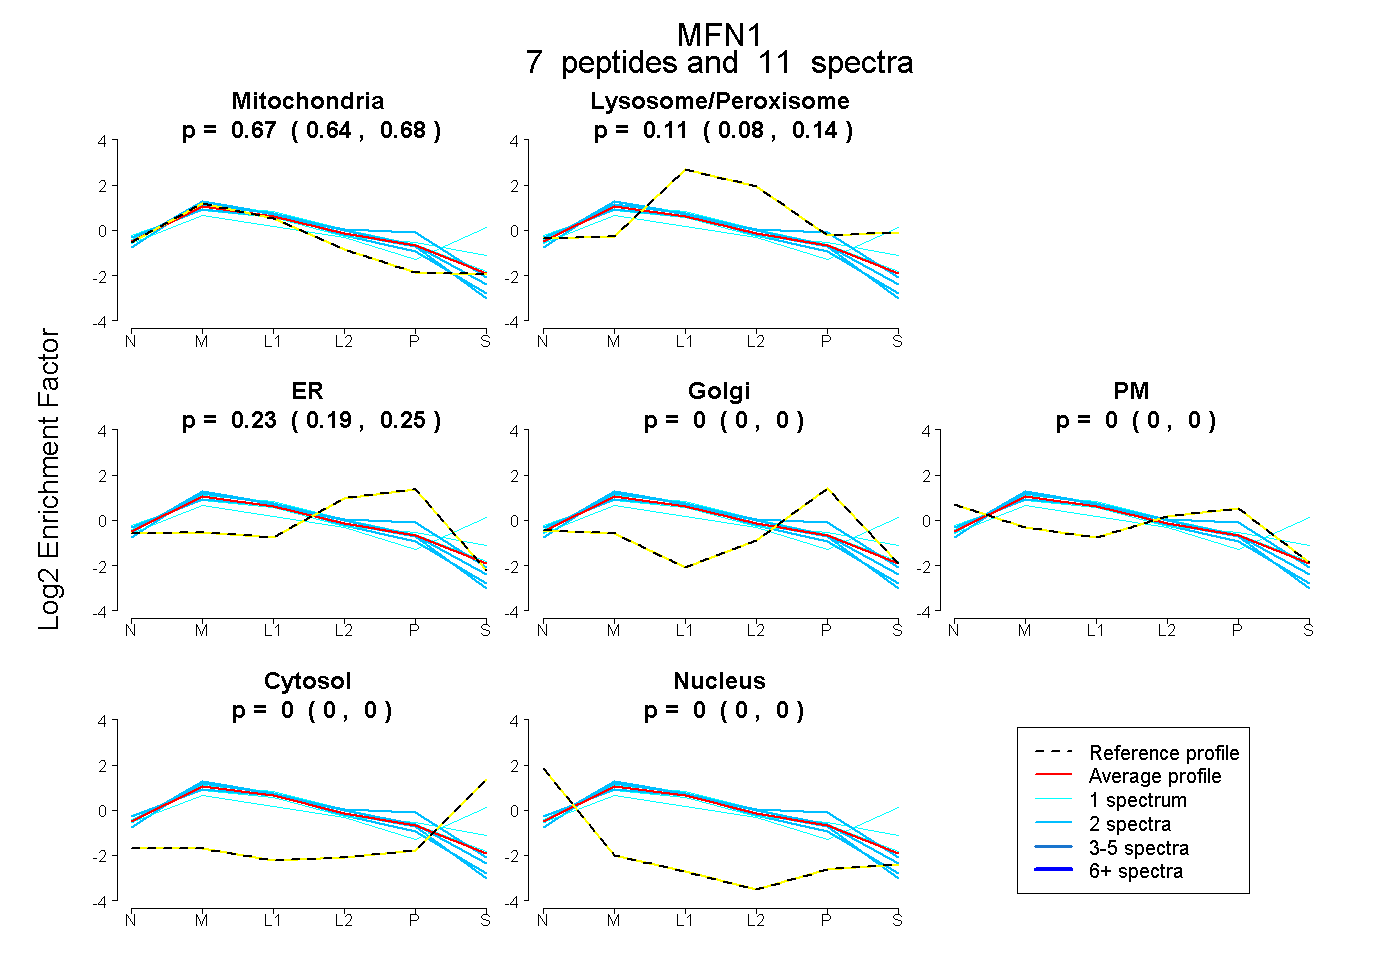 |
0.666
0.643 | 0.683 |
|
0.108
0.076 | 0.137 |
|
0.226
0.191 | 0.247 |
0.000
0.000 | 0.000 |
0.000
0.000 | 0.000 |
0.000
0.000 | 0.000 |
0.000
0.000 | 0.000 |
|
| 2 spectra, AVQLER |
0.787 |
|
0.000 |
|
0.213 |
0.000 |
0.000 |
0.000 |
0.000 |
|
| 1 spectrum, IFFVSAK |
0.419 |
|
0.289 |
|
0.000 |
0.000 |
0.000 |
0.293 |
0.000 |
|
| 1 spectrum, HFVLAK |
0.628 |
|
0.169 |
|
0.203 |
0.000 |
0.000 |
0.000 |
0.000 |
|
| 2 spectra, LSKPNIFILNNR |
0.528 |
|
0.110 |
|
0.347 |
0.000 |
0.015 |
0.000 |
0.000 |
|
| 1 spectrum, ELENFSK |
0.533 |
|
0.254 |
|
0.000 |
0.173 |
0.040 |
0.000 |
0.000 |
|
| 2 spectra, HLEEEIAR |
0.734 |
|
0.000 |
|
0.266 |
0.000 |
0.000 |
0.000 |
0.000 |
|
| 2 spectra, VVSPLEAR |
0.676 |
|
0.076 |
|
0.248 |
0.000 |
0.000 |
0.000 |
0.000 |
|
| | | Plot |
|
Lyso |
|
|
|
|
|
|
|
Other |
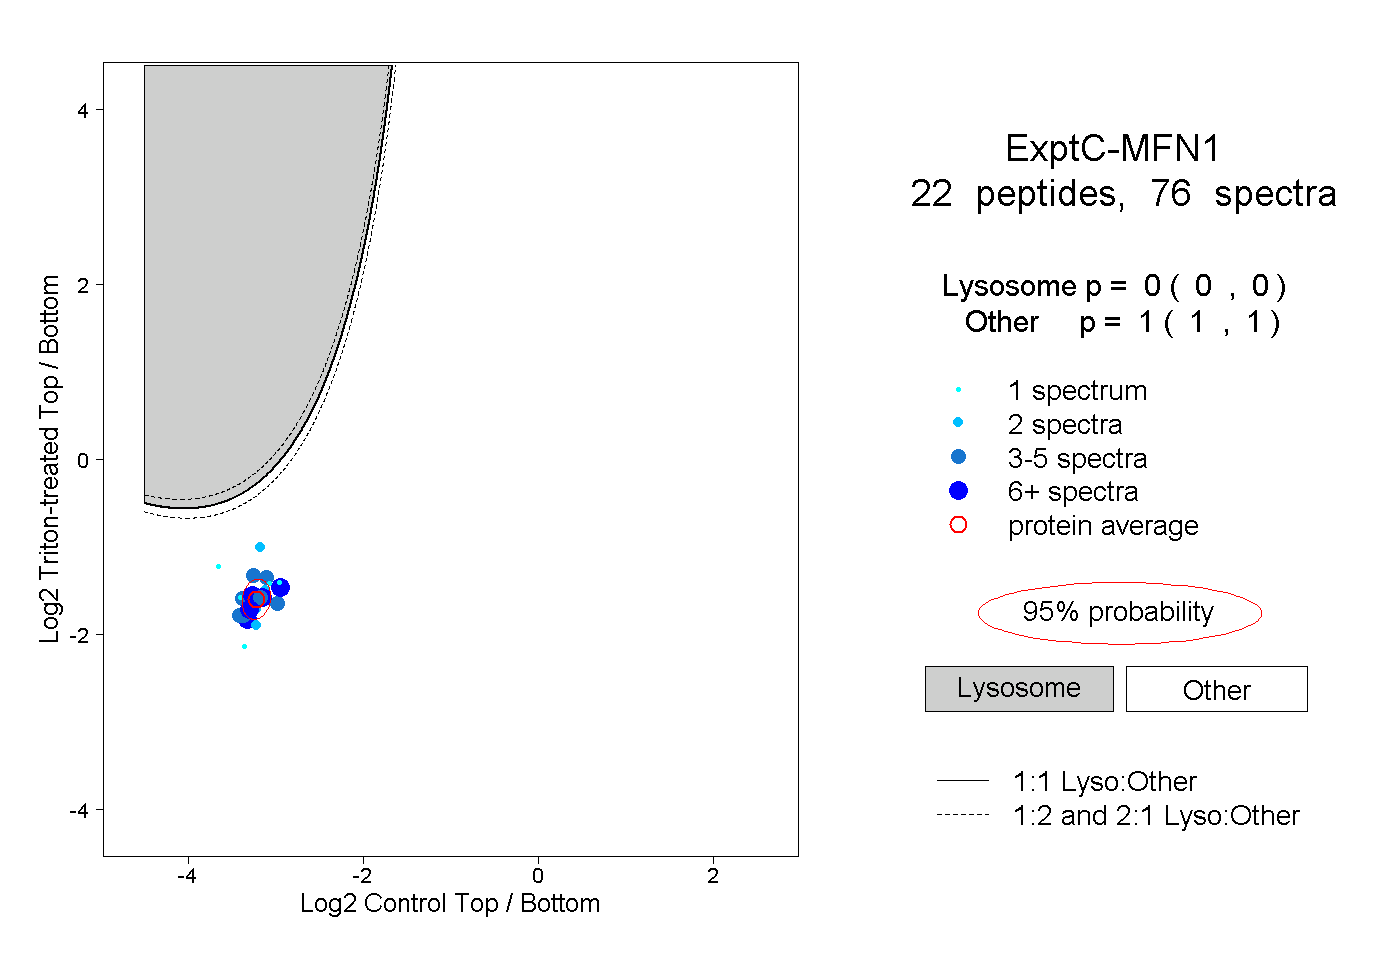
| Expt C |
22
peptides |
76
spectra |
 |
|
0.000
0.000 | 0.000 |
|
|
|
|
|
|
|
1.000
1.000 | 1.000 |
| | | Plot |
|
Lyso |
|
|
|
|
|
|
|
Other |
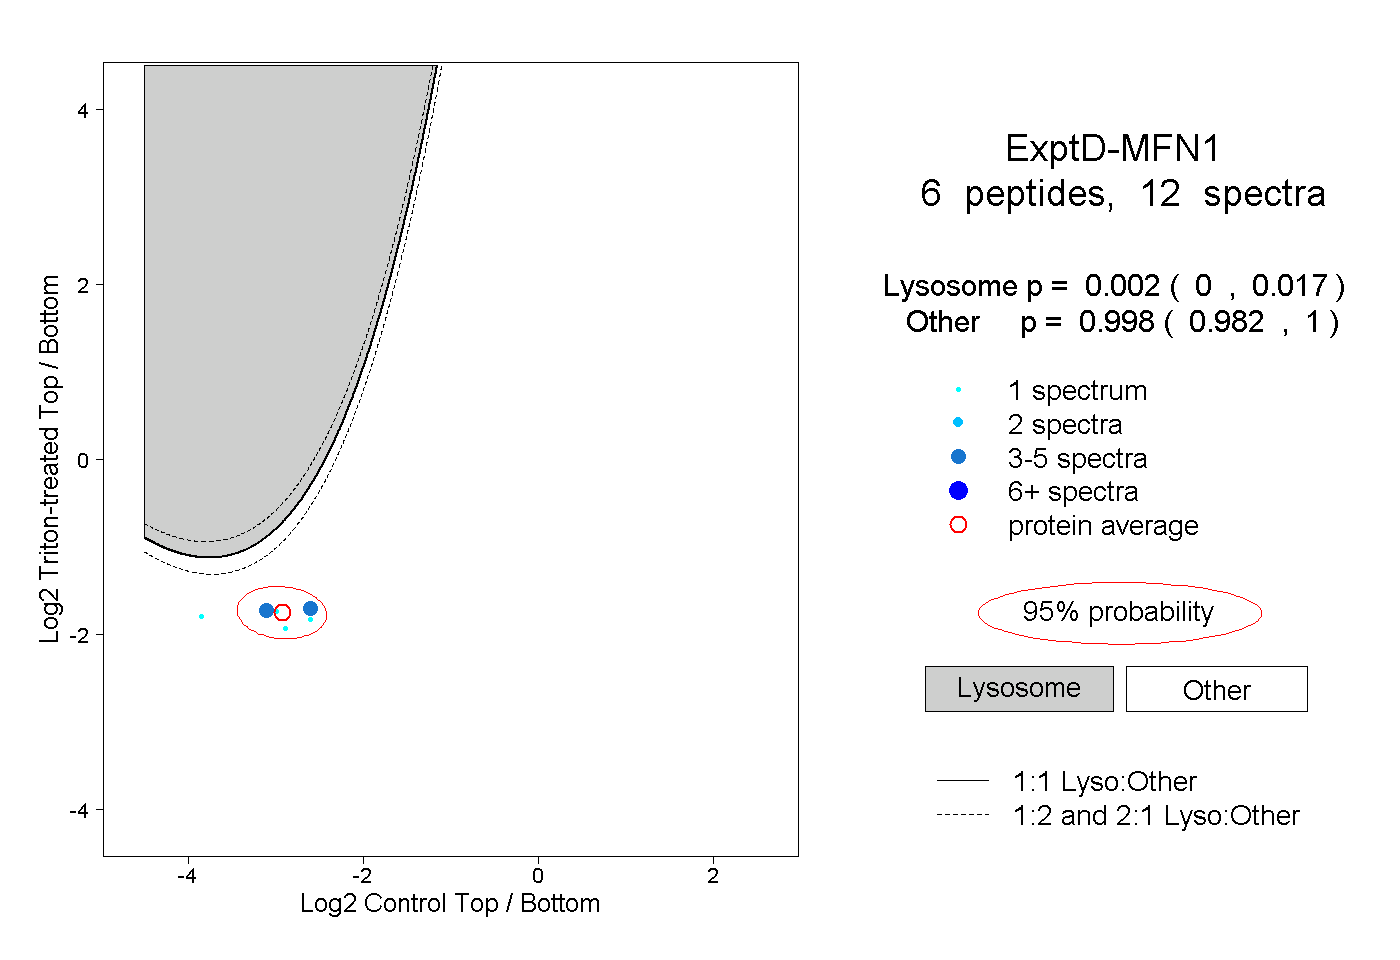
| Expt D |
6
peptides |
12
spectra |
 |
|
0.002
0.000 | 0.017 |
|
|
|
|
|
|
|
0.998
0.982 | 1.000 |