 5
5peptides
spectra
0.000 | 0.000
0.246 | 0.287
0.000 | 0.000
0.072 | 0.186
0.078 | 0.169
0.345 | 0.399
0.077 | 0.110
0.000 | 0.000
| Plot | Mito | Lyso | Perox | ER | Golgi | PM | Cytosol | Nucleus | |||||
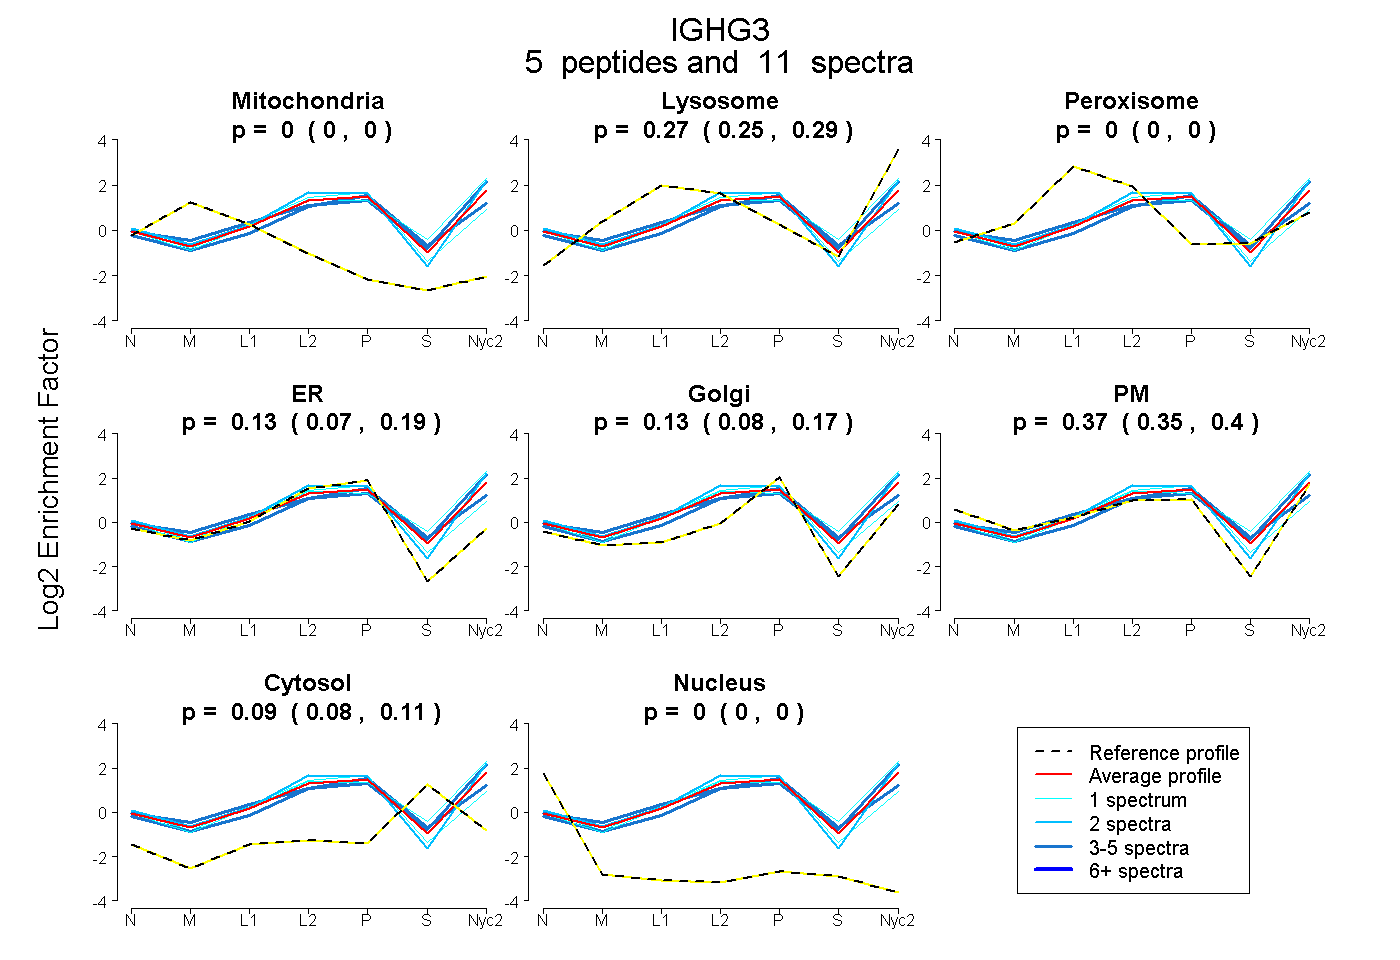
| Expt A |
5 peptides |
11 spectra |
|
0.000 0.000 | 0.000 |
0.268 0.246 | 0.287 |
0.000 0.000 | 0.000 |
0.135 0.072 | 0.186 |
0.129 0.078 | 0.169 |
0.374 0.345 | 0.399 |
0.095 0.077 | 0.110 |
0.000 0.000 | 0.000 |
| 1 spectrum, NTLPVLDSDESYFLYSK | 0.000 | 0.348 | 0.000 | 0.000 | 0.081 | 0.427 | 0.144 | 0.000 | ||
| 4 spectra, LSVDTDSWMR | 0.000 | 0.341 | 0.000 | 0.000 | 0.121 | 0.436 | 0.102 | 0.000 | ||
| 1 spectrum, DILMITLTPK | 0.000 | 0.145 | 0.017 | 0.479 | 0.000 | 0.280 | 0.079 | 0.000 | ||
| 2 spectra, NGELEQDYK | 0.000 | 0.252 | 0.000 | 0.111 | 0.108 | 0.529 | 0.000 | 0.000 | ||
| 3 spectra, DLPSPIEK | 0.000 | 0.210 | 0.000 | 0.227 | 0.195 | 0.194 | 0.173 | 0.000 |
| Plot | Mito | Lyso or Perox | ER | Golgi | PM | Cytosol | Nucleus | ||||||
| Expt B |
4 peptides |
5 spectra |
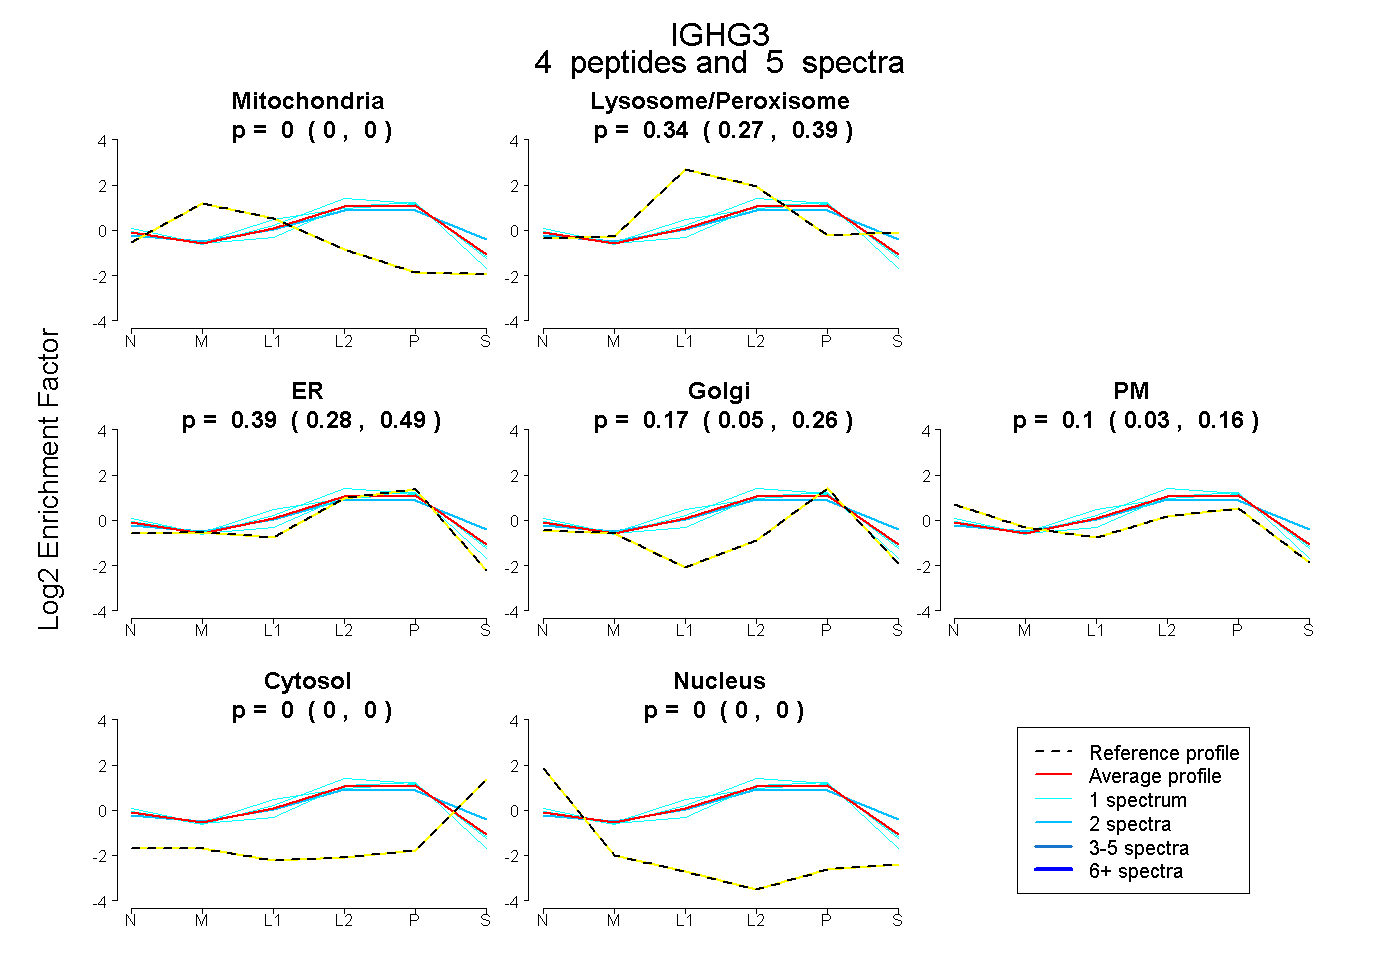 |
0.000 0.000 | 0.000 |
0.339 0.271 | 0.394 |
0.394 0.283 | 0.489 |
0.166 0.049 | 0.257 |
0.102 0.028 | 0.165 |
0.000 0.000 | 0.000 |
0.000 0.000 | 0.000 |
|||
| Plot | Lyso | Other | |||||||||||
| Expt C |
6 peptides |
24 spectra |
 |
0.000 0.000 | 0.001 |
1.000 0.999 | 1.000 |
||||||||
| Plot | Lyso | Other | |||||||||||
| Expt D |
1 peptide |
2 spectra |
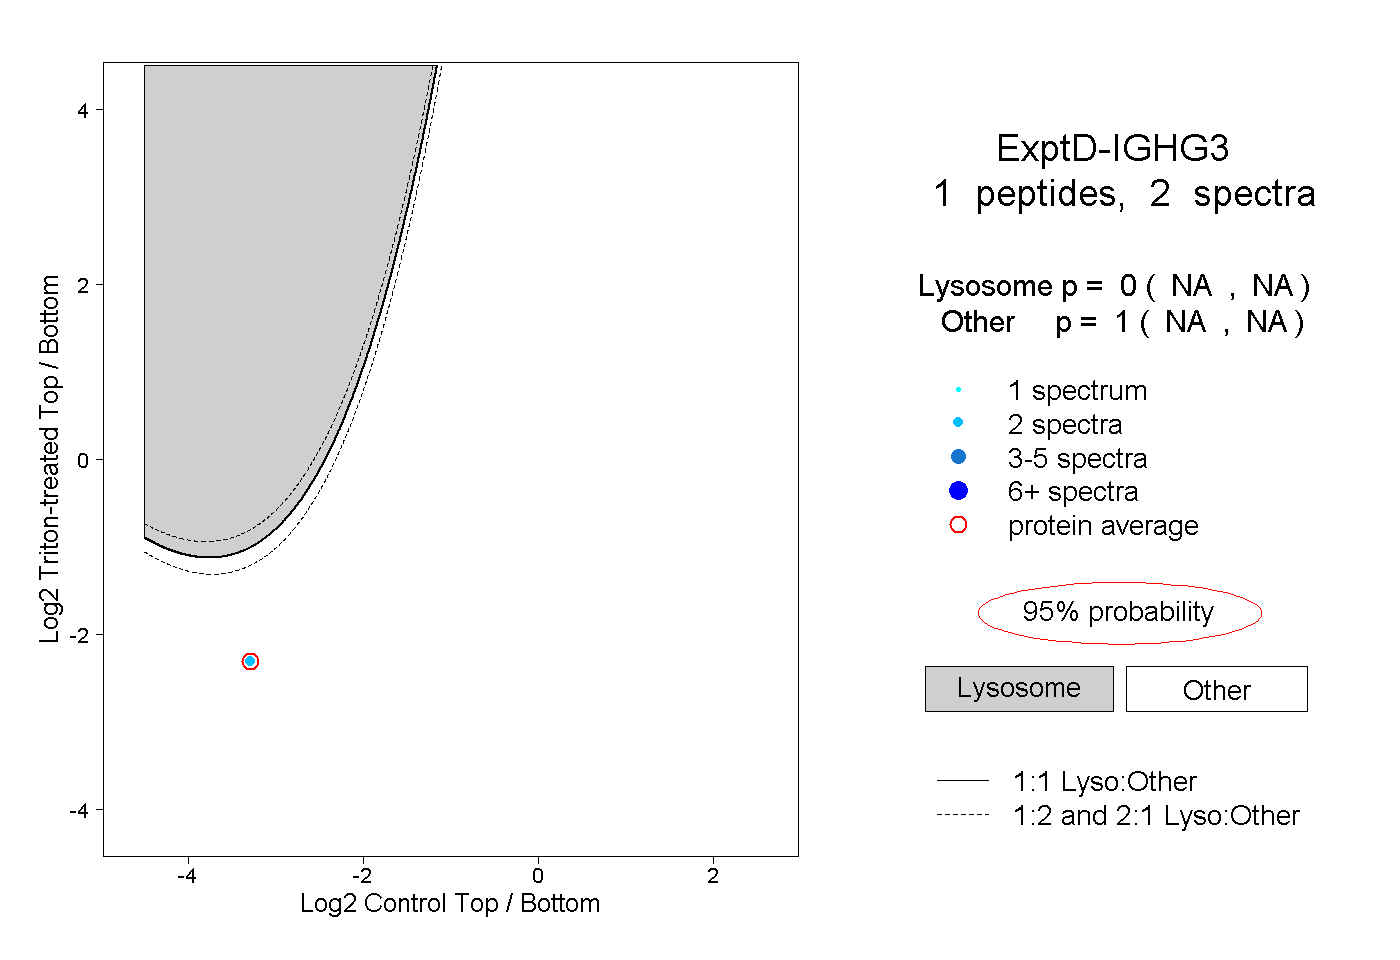 |
0.000 NA | NA |
1.000 NA | NA |