 5
5peptides
spectra
0.000 | 0.000
0.054 | 0.135
0.000 | 0.082
0.000 | 0.000
0.000 | 0.063
0.126 | 0.213
0.633 | 0.679
0.000 | 0.000
| Plot | Mito | Lyso | Perox | ER | Golgi | PM | Cytosol | Nucleus | |||||
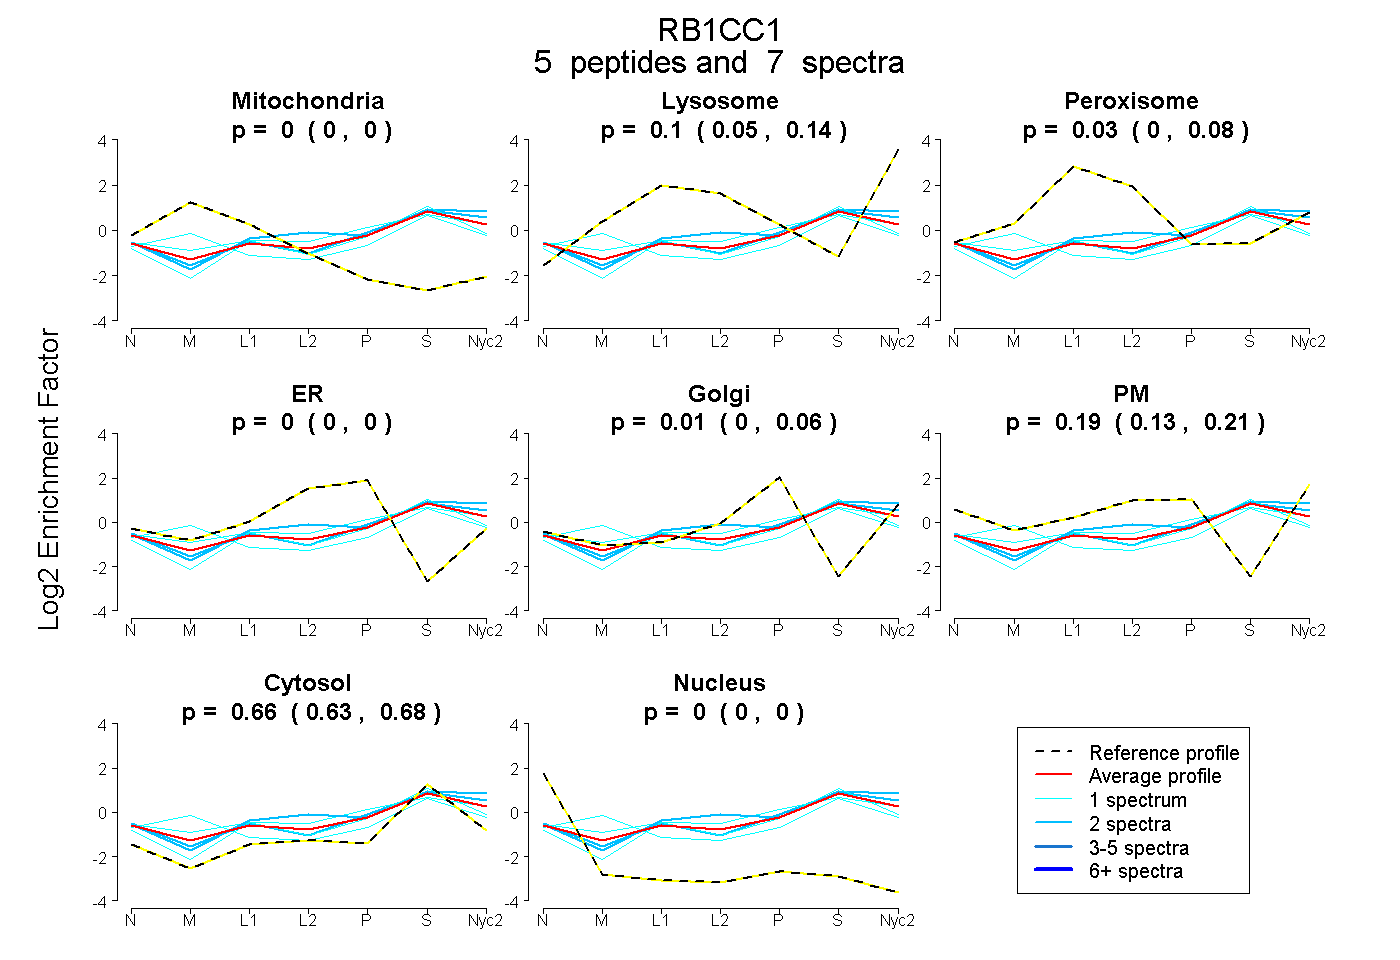
| Expt A |
5 peptides |
7 spectra |
|
0.000 0.000 | 0.000 |
0.101 0.054 | 0.135 |
0.033 0.000 | 0.082 |
0.000 0.000 | 0.000 |
0.014 0.000 | 0.063 |
0.191 0.126 | 0.213 |
0.661 0.633 | 0.679 |
0.000 0.000 | 0.000 |
| 2 spectra, HTEEFEK | 0.000 | 0.228 | 0.000 | 0.000 | 0.000 | 0.153 | 0.619 | 0.000 | ||
| 1 spectrum, FLEQLEEQEK | 0.000 | 0.070 | 0.141 | 0.000 | 0.154 | 0.094 | 0.540 | 0.000 | ||
| 1 spectrum, IPLLECLTR | 0.000 | 0.040 | 0.096 | 0.000 | 0.129 | 0.000 | 0.735 | 0.000 | ||
| 2 spectra, EDSSSLVAELQEK | 0.000 | 0.135 | 0.000 | 0.000 | 0.027 | 0.174 | 0.663 | 0.000 | ||
| 1 spectrum, SPAFESAR | 0.220 | 0.110 | 0.000 | 0.000 | 0.085 | 0.000 | 0.586 | 0.000 |
| Plot | Lyso | Other | |||||||||||
| Expt C |
14 peptides |
27 spectra |
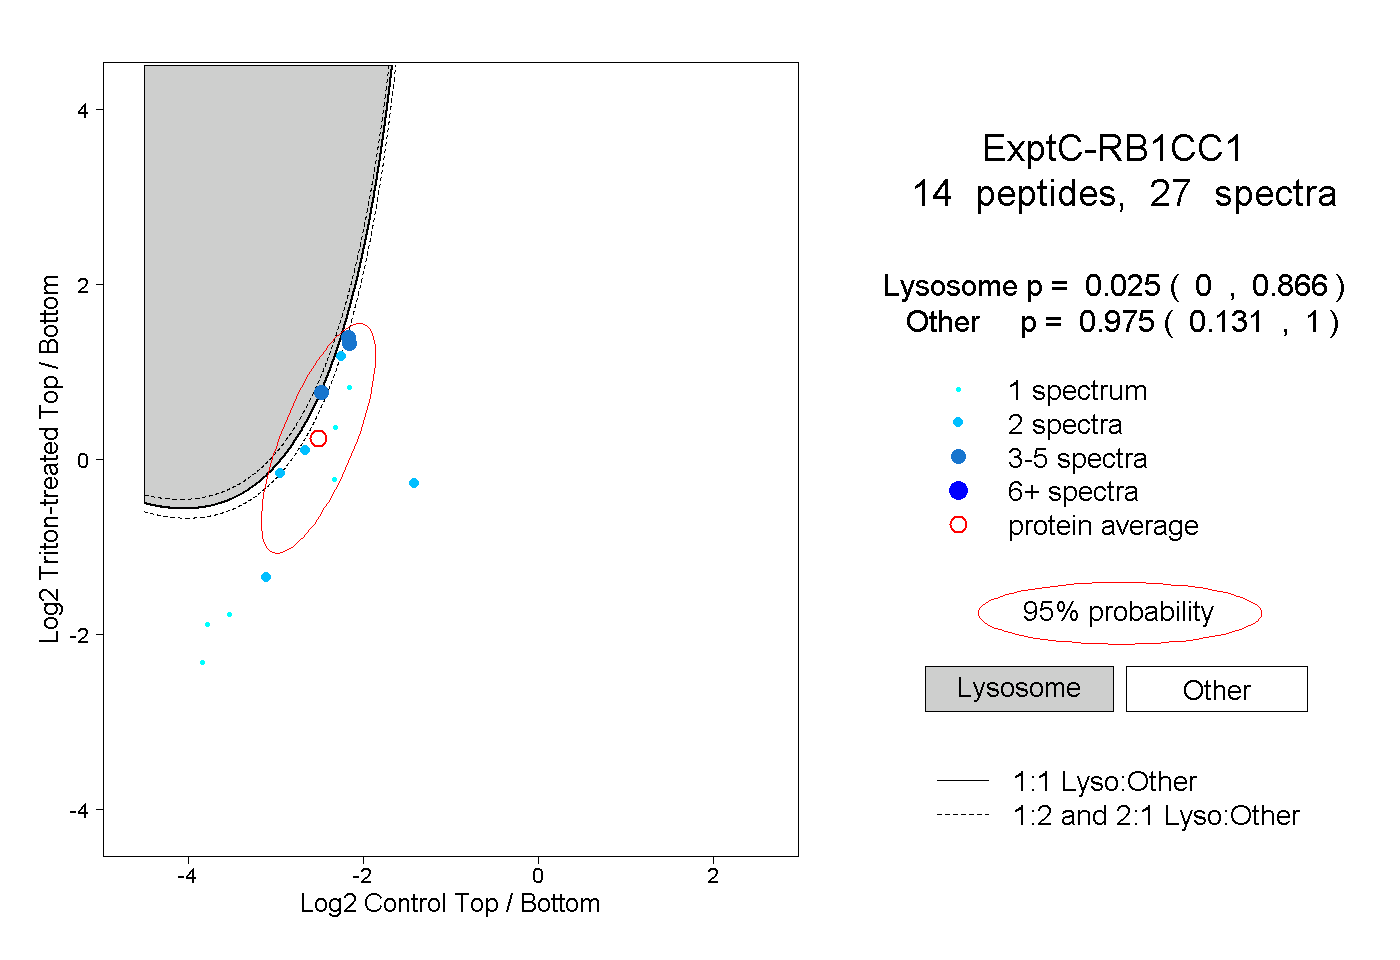 |
0.025 0.000 | 0.866 |
0.975 0.131 | 1.000 |
||||||||
| Plot | Lyso | Other | |||||||||||
| Expt D |
1 peptide |
1 spectrum |
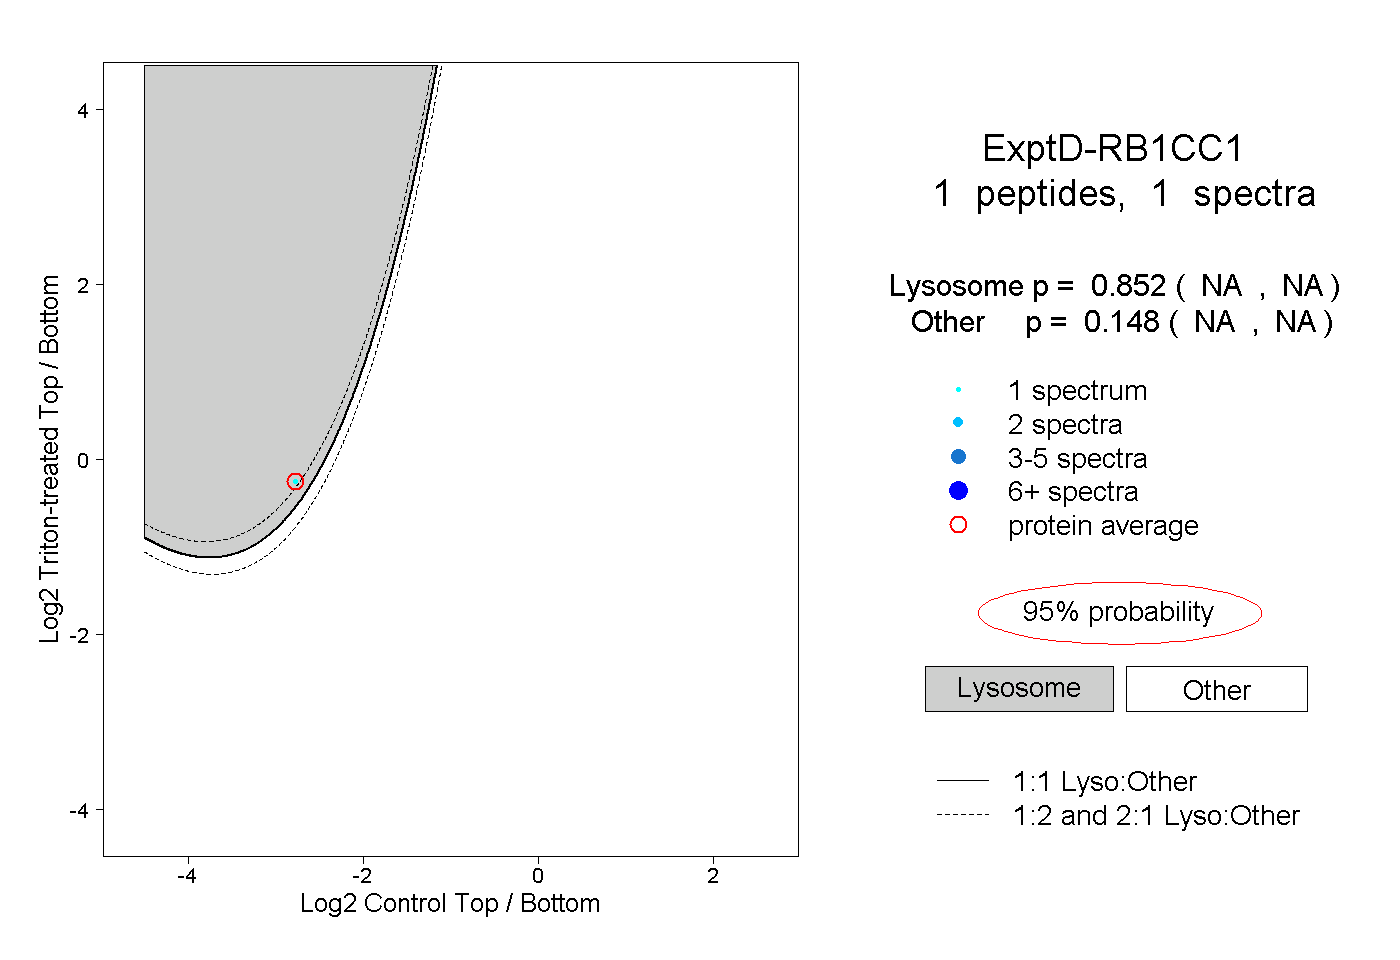 |
0.852 NA | NA |
0.148 NA | NA |