 3
3peptides
spectra
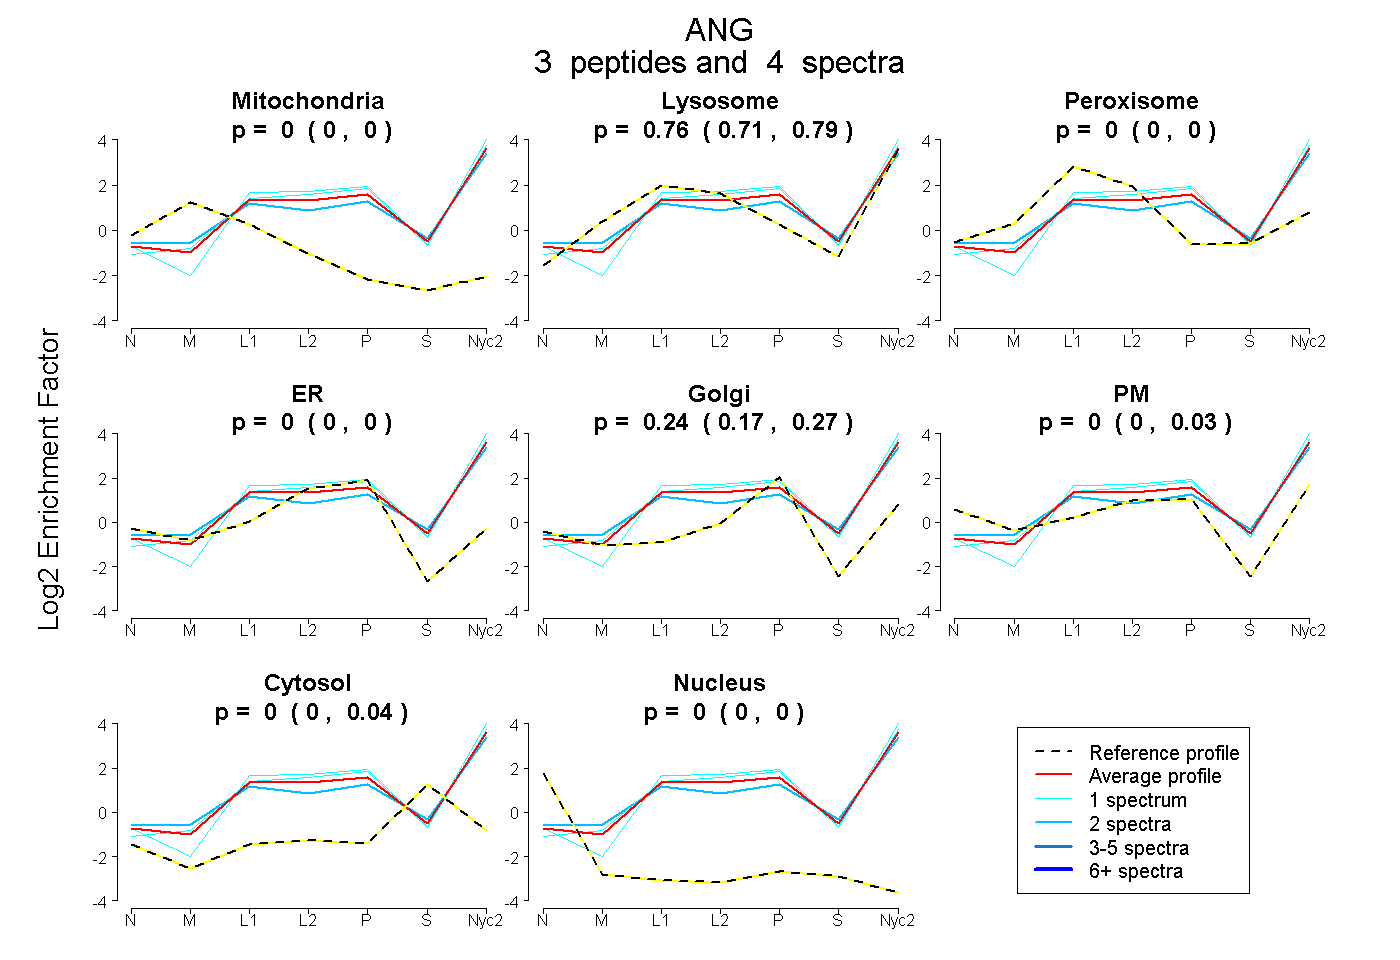
0.000 | 0.000
0.711 | 0.791
0.000 | 0.000
0.000 | 0.000
0.173 | 0.267
0.000 | 0.034
0.000 | 0.037
0.000 | 0.000
1peptide
spectra
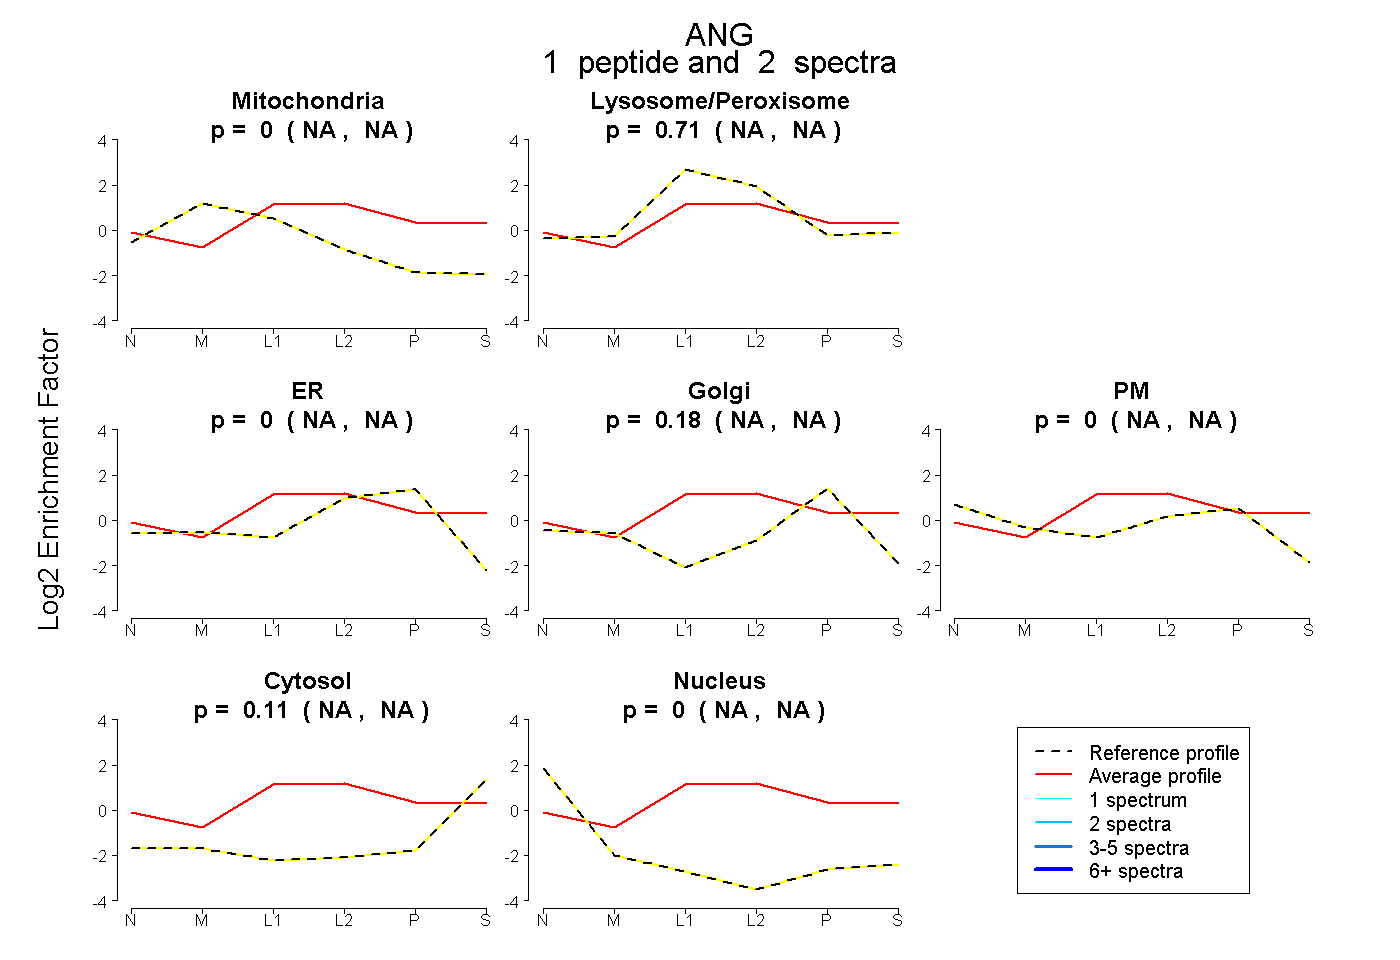
NA | NA
NA | NA
NA | NA
NA | NA
NA | NA
NA | NA
NA | NA
6peptides
spectra
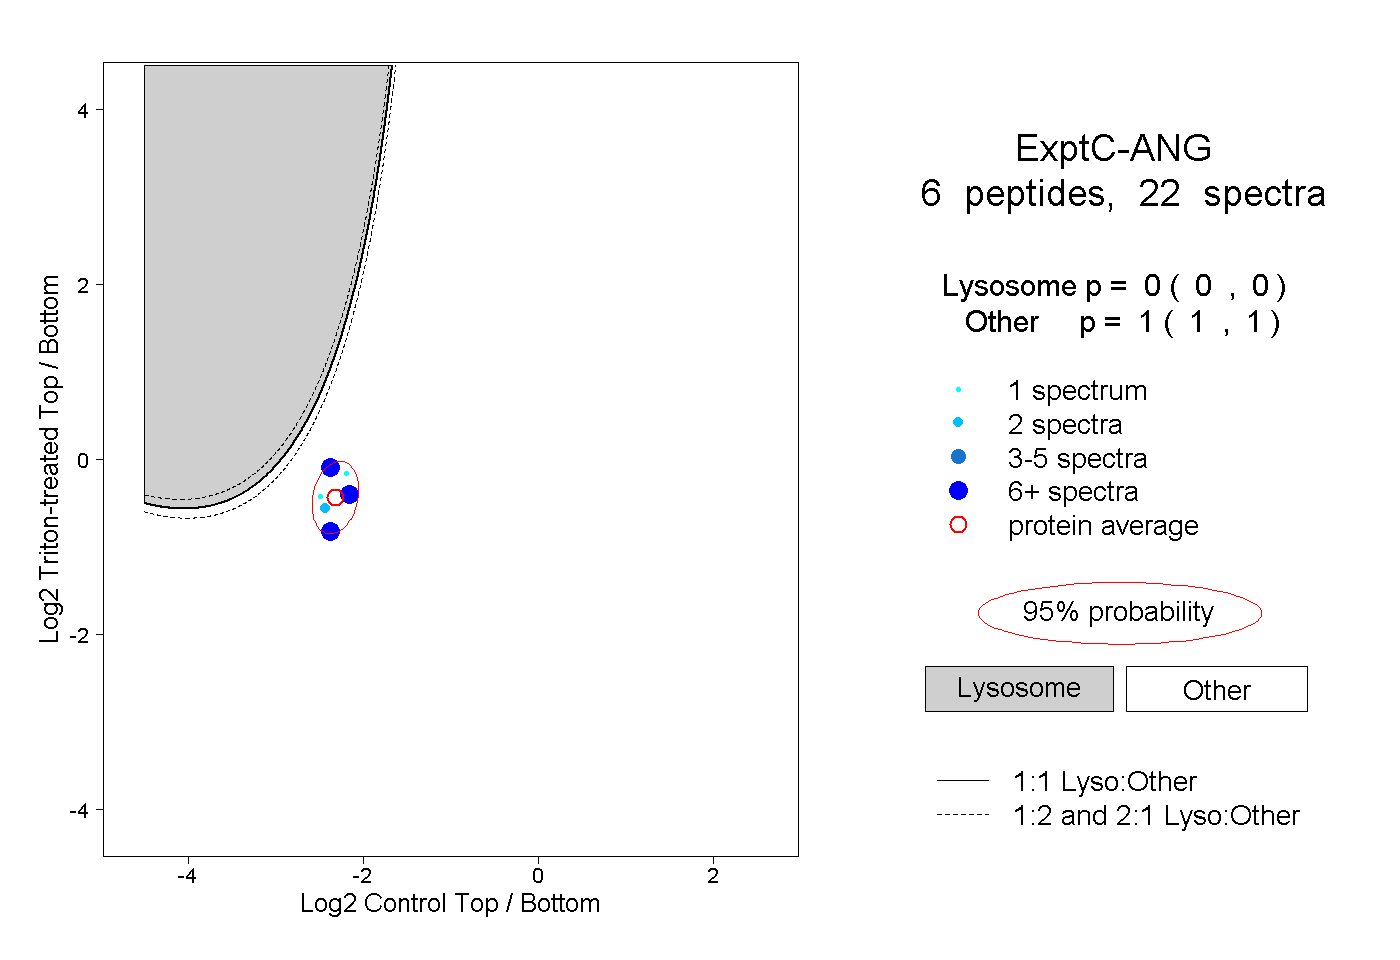
0.000 | 0.000
1.000 | 1.000
2peptides
spectra
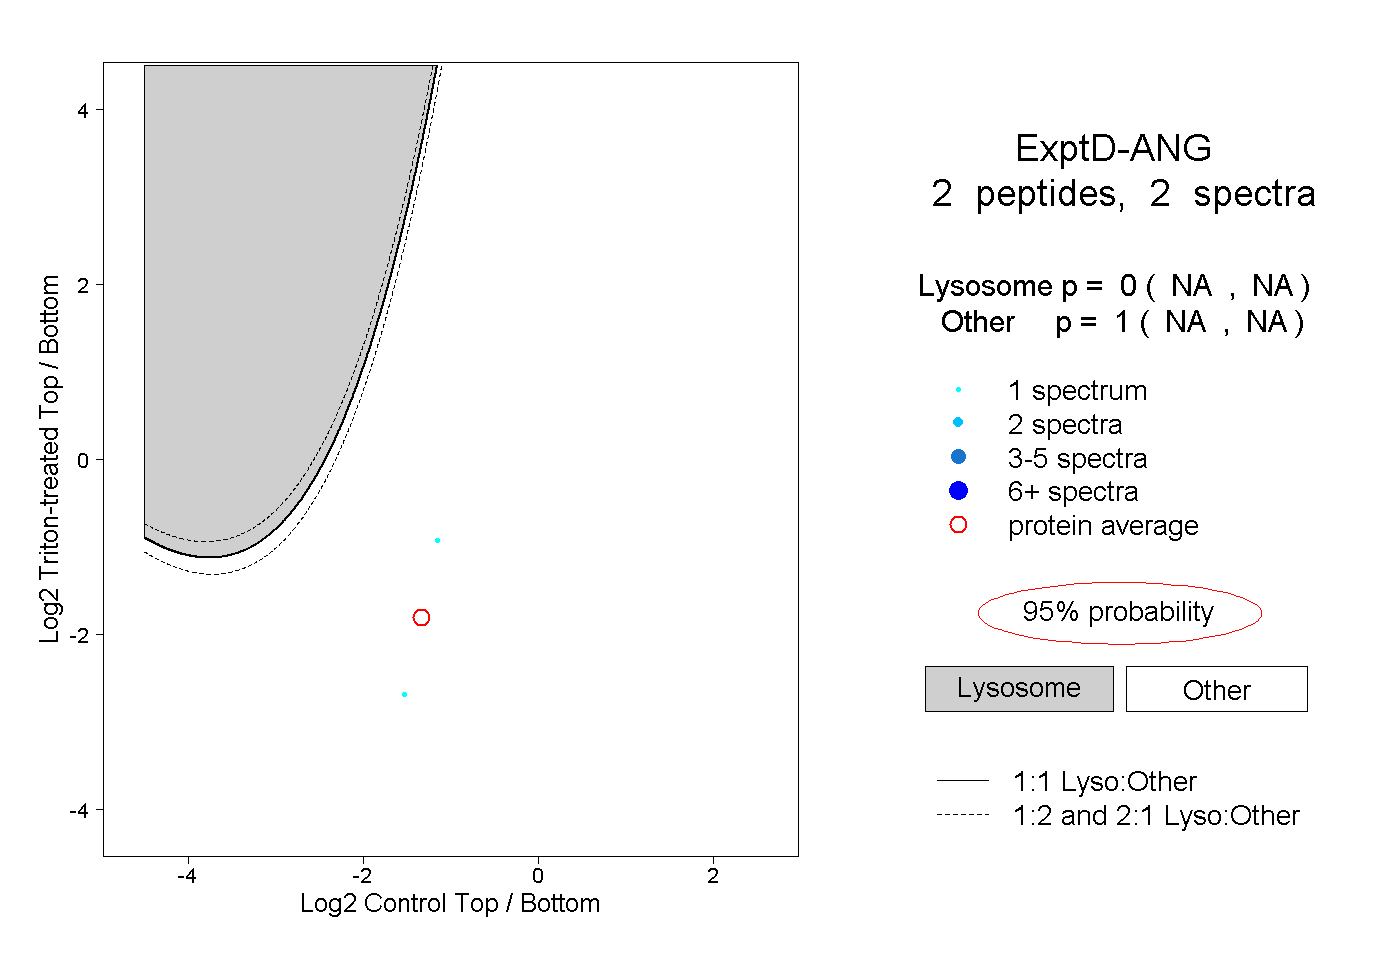
NA | NA
NA | NA