 5
5peptides
spectra
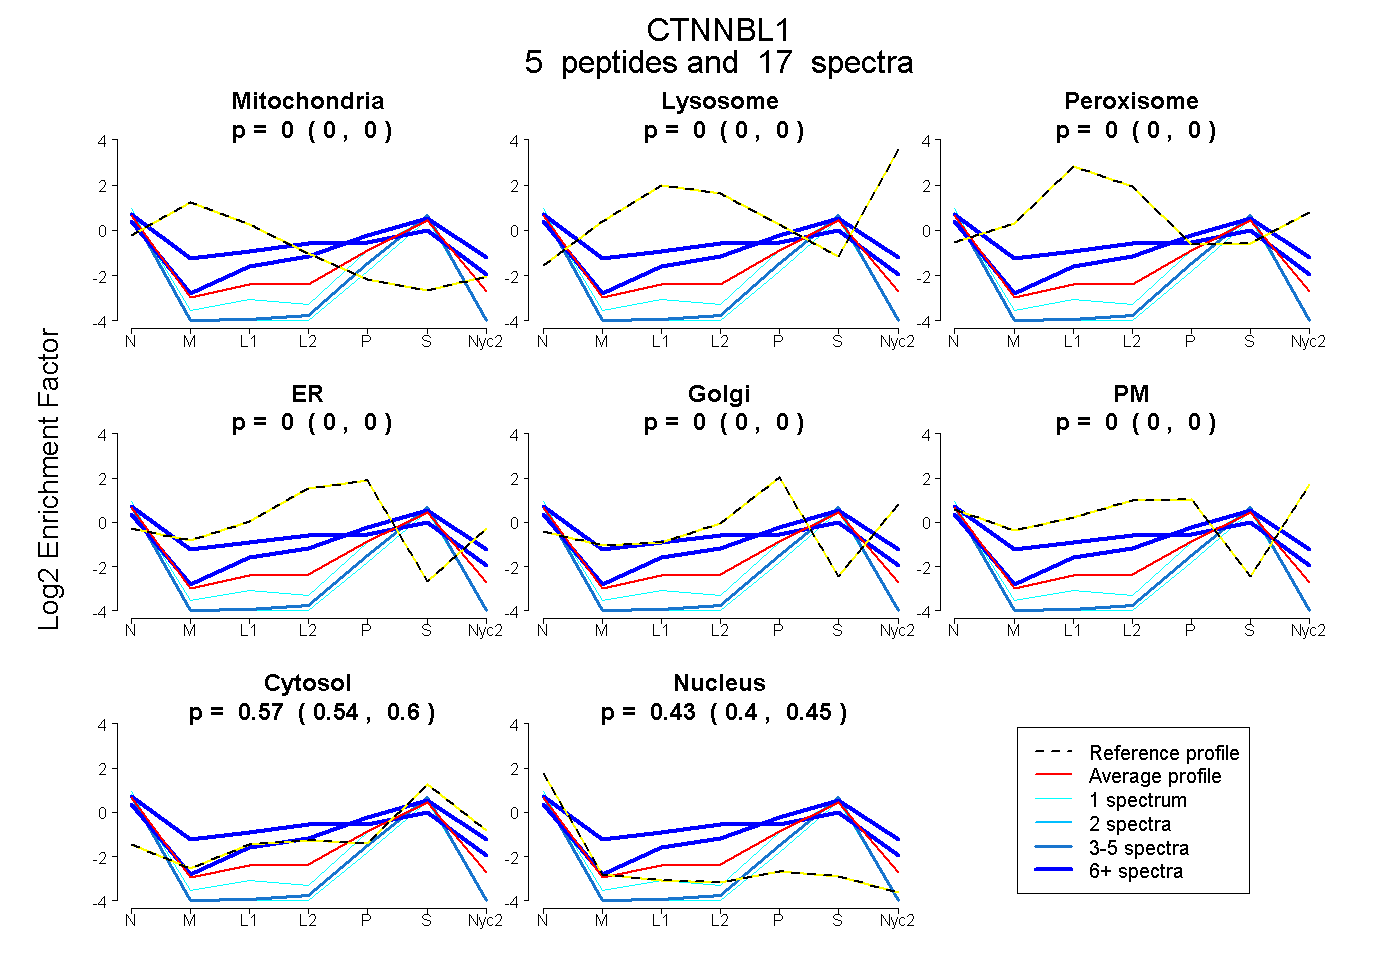
0.000 | 0.000
0.000 | 0.000
0.000 | 0.000
0.000 | 0.000
0.000 | 0.000
0.000 | 0.000
0.544 | 0.595
0.398 | 0.453
| Plot | Mito | Lyso | Perox | ER | Golgi | PM | Cytosol | Nucleus | |||||
| Expt A |
5 peptides |
17 spectra |
|
0.000 0.000 | 0.000 |
0.000 0.000 | 0.000 |
0.000 0.000 | 0.000 |
0.000 0.000 | 0.000 |
0.000 0.000 | 0.000 |
0.000 0.000 | 0.000 |
0.571 0.544 | 0.595 |
0.429 0.398 | 0.453 |
| 6 spectra, VHQILNMR | 0.000 | 0.000 | 0.201 | 0.156 | 0.000 | 0.000 | 0.356 | 0.286 | ||
| 3 spectra, LMELHFK | 0.000 | 0.000 | 0.000 | 0.000 | 0.000 | 0.000 | 0.362 | 0.638 | ||
| 1 spectrum, GEGLQLMNLMLR | 0.000 | 0.000 | 0.000 | 0.000 | 0.000 | 0.000 | 0.418 | 0.582 | ||
| 6 spectra, TIFPLFMK | 0.000 | 0.000 | 0.000 | 0.065 | 0.128 | 0.000 | 0.638 | 0.169 | ||
| 1 spectrum, FVDILGLR | 0.000 | 0.000 | 0.000 | 0.000 | 0.000 | 0.000 | 0.308 | 0.692 |
| Plot | Lyso | Other | |||||||||||
| Expt C |
2 peptides |
2 spectra |
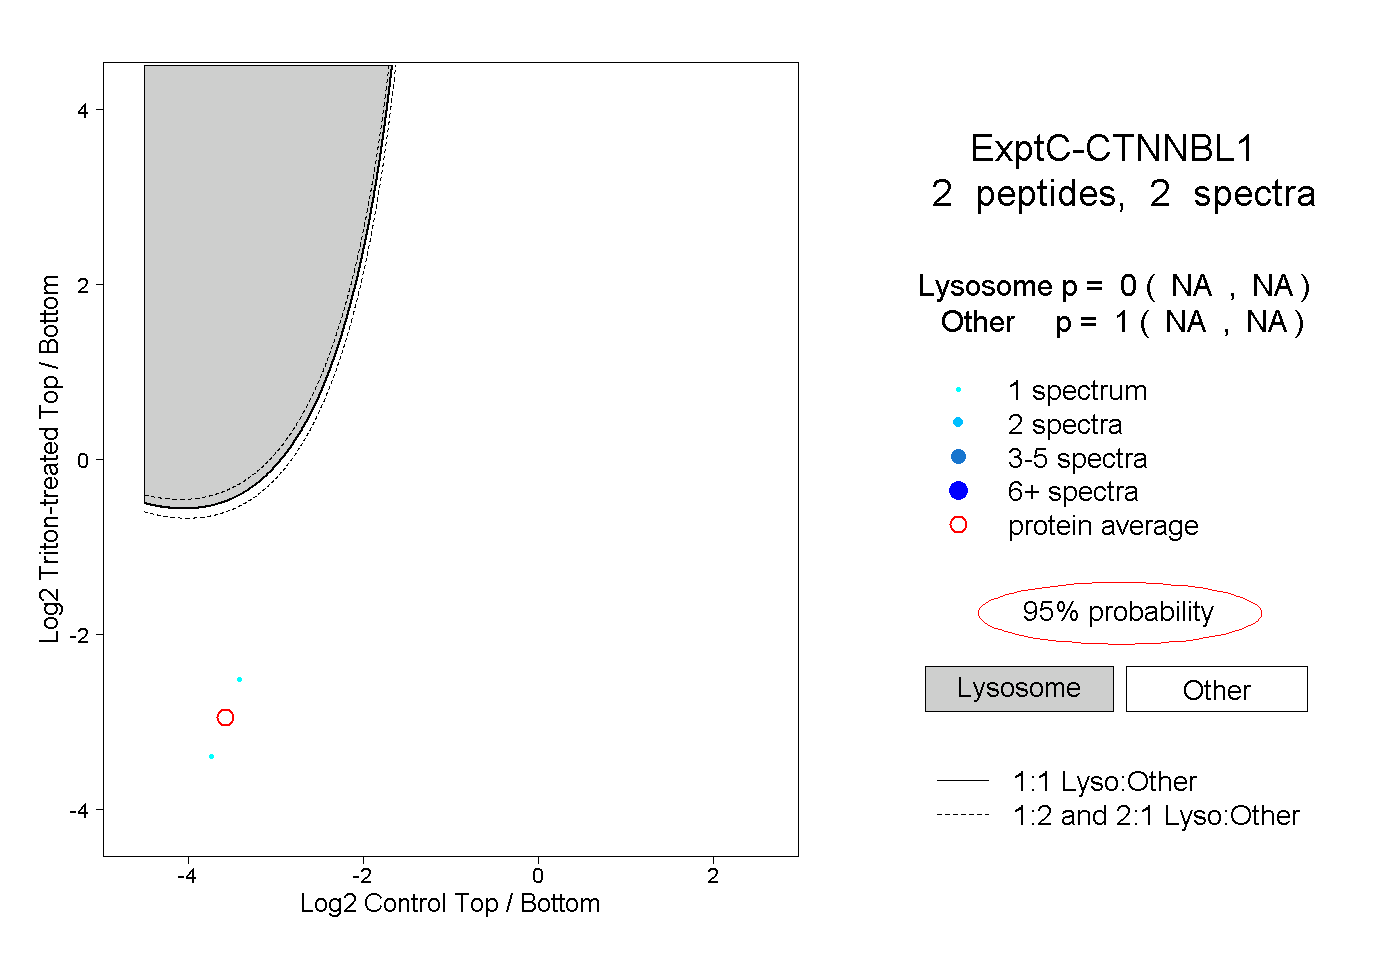 |
0.000 NA | NA |
1.000 NA | NA |