 5
5peptides
spectra
0.000 | 0.000
0.000 | 0.000
0.000 | 0.000
0.000 | 0.000
0.000 | 0.101
0.528 | 0.628
0.337 | 0.399
0.000 | 0.000
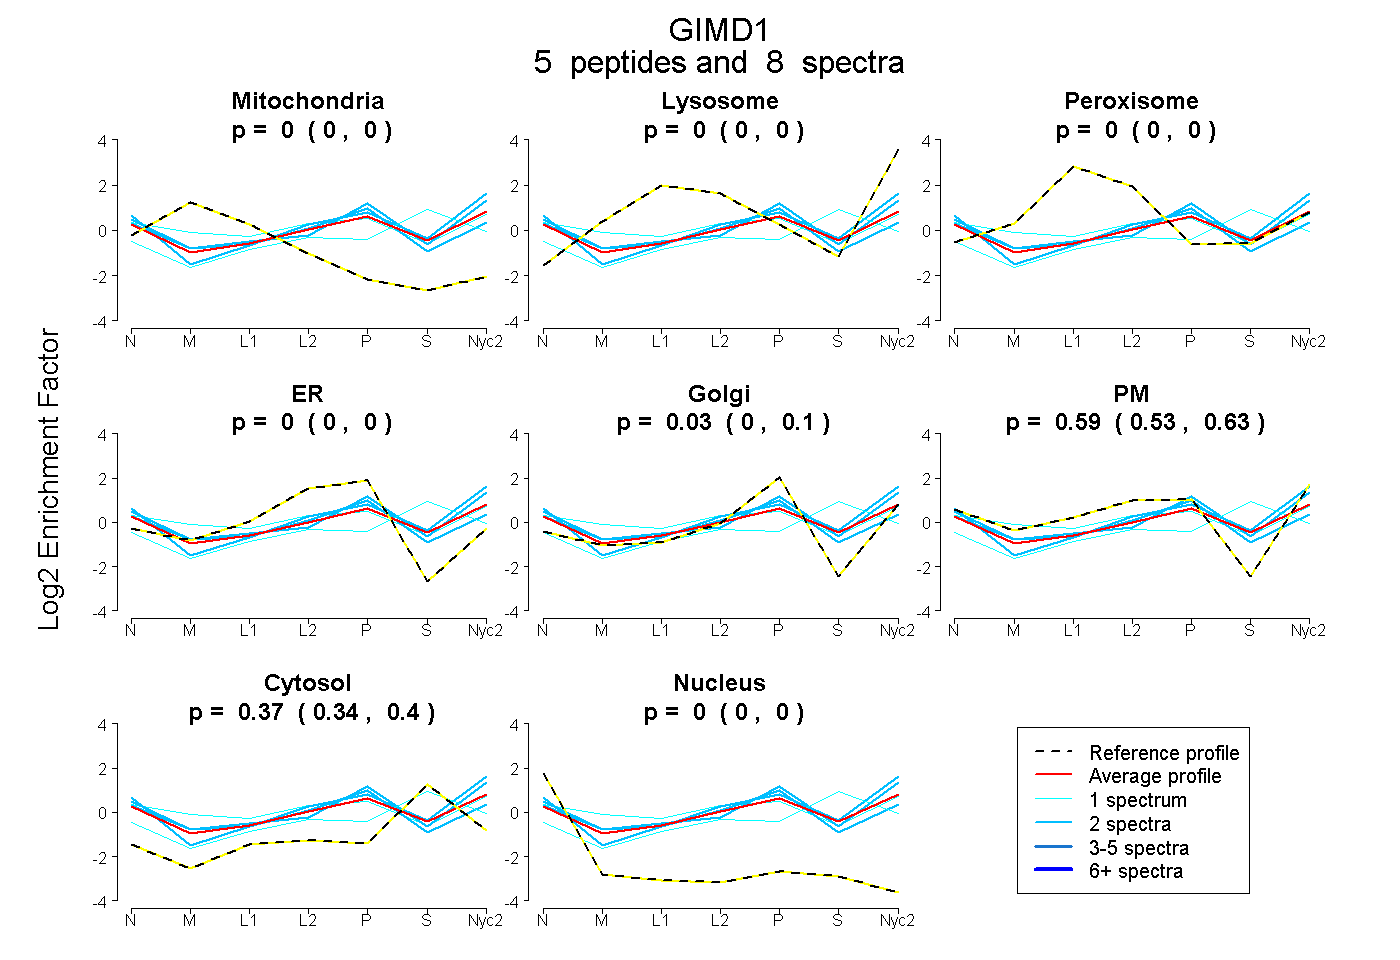
| Plot | Mito | Lyso | Perox | ER | Golgi | PM | Cytosol | Nucleus | |||||
| Expt A |
5 peptides |
8 spectra |
|
0.000 0.000 | 0.000 |
0.000 0.000 | 0.000 |
0.000 0.000 | 0.000 |
0.000 0.000 | 0.000 |
0.033 0.000 | 0.101 |
0.593 0.528 | 0.628 |
0.374 0.337 | 0.399 |
0.000 0.000 | 0.000 |
| 1 spectrum, MIINLAVLGK | 0.000 | 0.000 | 0.084 | 0.000 | 0.000 | 0.225 | 0.690 | 0.000 | ||
| 2 spectra, FAPGSVTK | 0.000 | 0.000 | 0.000 | 0.069 | 0.175 | 0.467 | 0.263 | 0.026 | ||
| 2 spectra, IMEFIK | 0.000 | 0.000 | 0.000 | 0.000 | 0.000 | 0.673 | 0.327 | 0.000 | ||
| 1 spectrum, DCSLGR | 0.038 | 0.000 | 0.091 | 0.000 | 0.000 | 0.603 | 0.268 | 0.000 | ||
| 2 spectra, HIFLYER | 0.000 | 0.044 | 0.000 | 0.000 | 0.236 | 0.465 | 0.256 | 0.000 |
| Plot | Lyso | Other | |||||||||||
| Expt C |
3 peptides |
5 spectra |
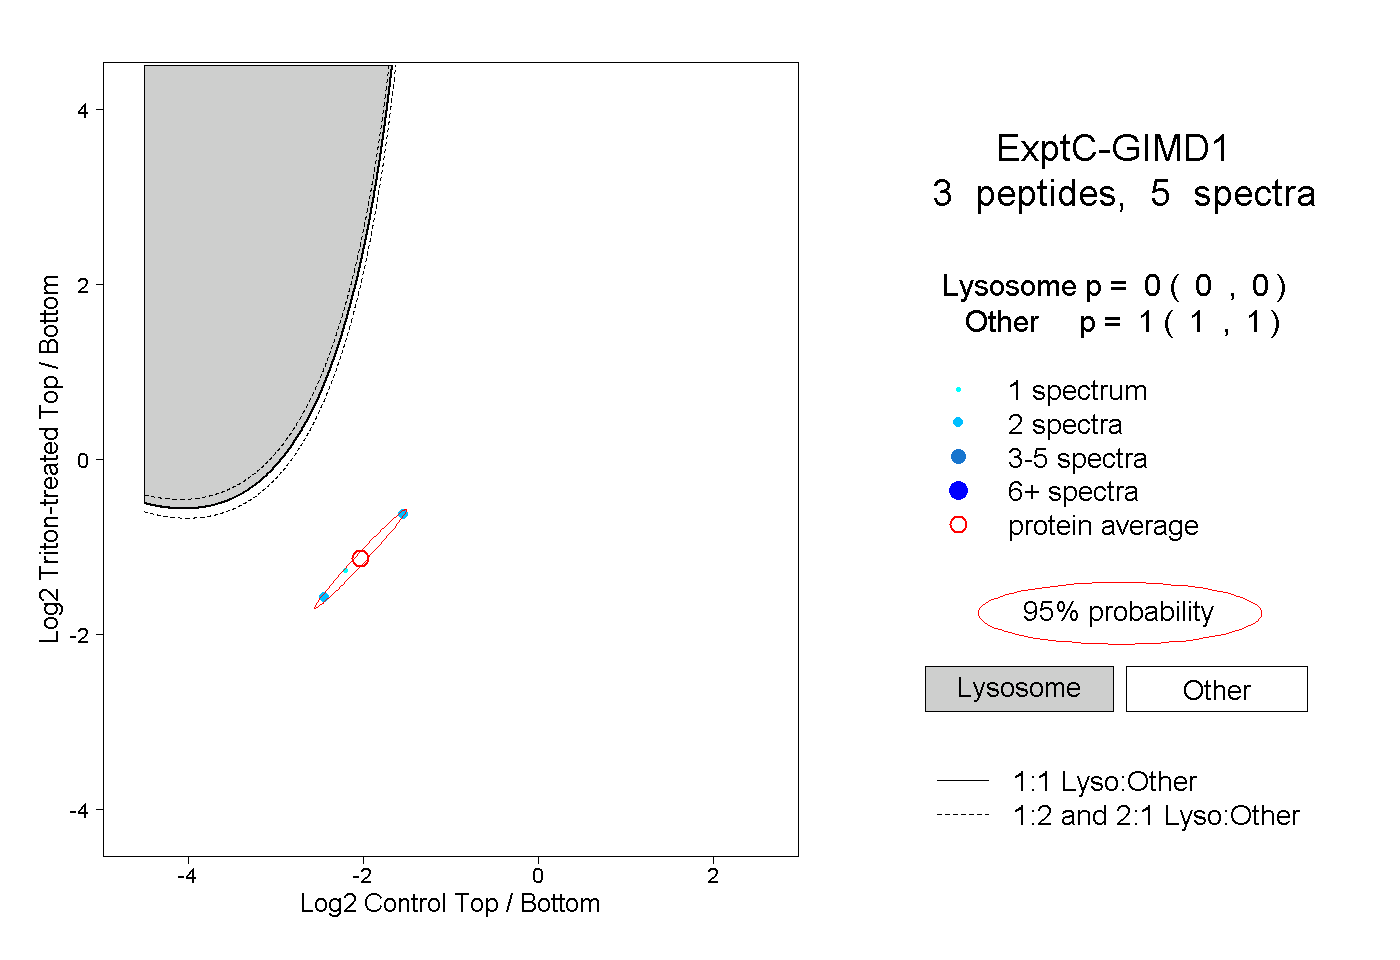 |
0.000 0.000 | 0.000 |
1.000 1.000 | 1.000 |
||||||||
| Plot | Lyso | Other | |||||||||||
| Expt D |
1 peptide |
2 spectra |
 |
0.000 NA | NA |
1.000 NA | NA |