 5
5peptides
spectra
0.000 | 0.000
0.000 | 0.000
0.000 | 0.000
0.000 | 0.101
0.000 | 0.188
0.000 | 0.000
0.374 | 0.406
0.403 | 0.516
1peptide
spectrum

NA | NA
NA | NA
NA | NA
NA | NA
NA | NA
NA | NA
NA | NA
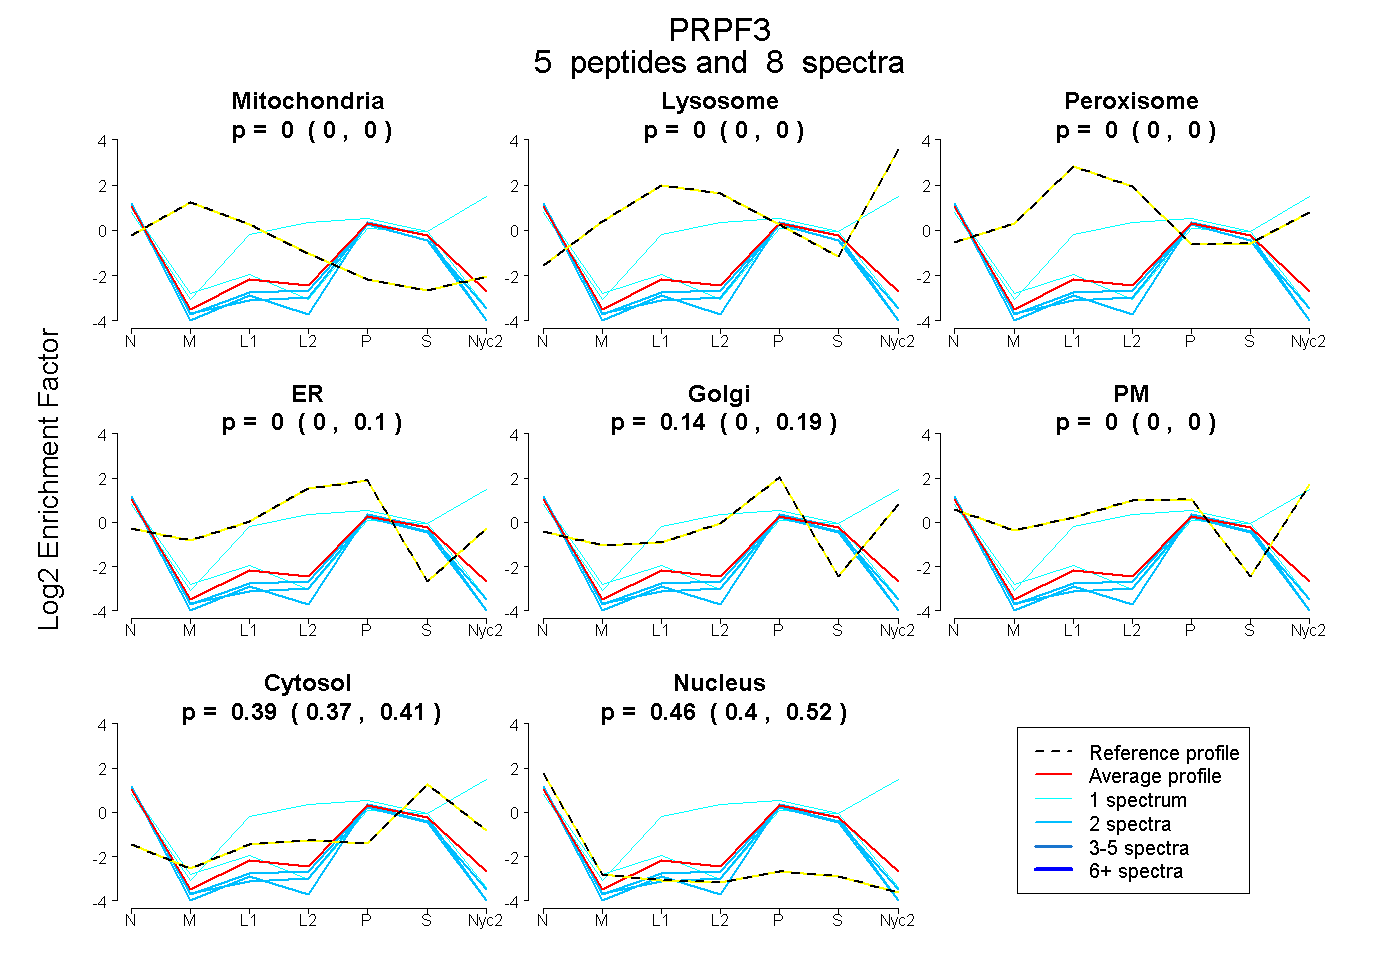
| Plot | Mito | Lyso | Perox | ER | Golgi | PM | Cytosol | Nucleus | |||||
| Expt A |
5 peptides |
8 spectra |
|
0.000 0.000 | 0.000 |
0.000 0.000 | 0.000 |
0.000 0.000 | 0.000 |
0.000 0.000 | 0.101 |
0.144 0.000 | 0.188 |
0.000 0.000 | 0.000 |
0.392 0.374 | 0.406 |
0.464 0.403 | 0.516 |
||
| Plot | Mito | Lyso or Perox | ER | Golgi | PM | Cytosol | Nucleus | ||||||
| Expt B |
1 peptide |
1 spectrum |
|
0.000 NA | NA |
0.000 NA | NA |
0.000 NA | NA |
0.102 NA | NA |
0.561 NA | NA |
0.009 NA | NA |
0.328 NA | NA |