 23
23peptides
spectra
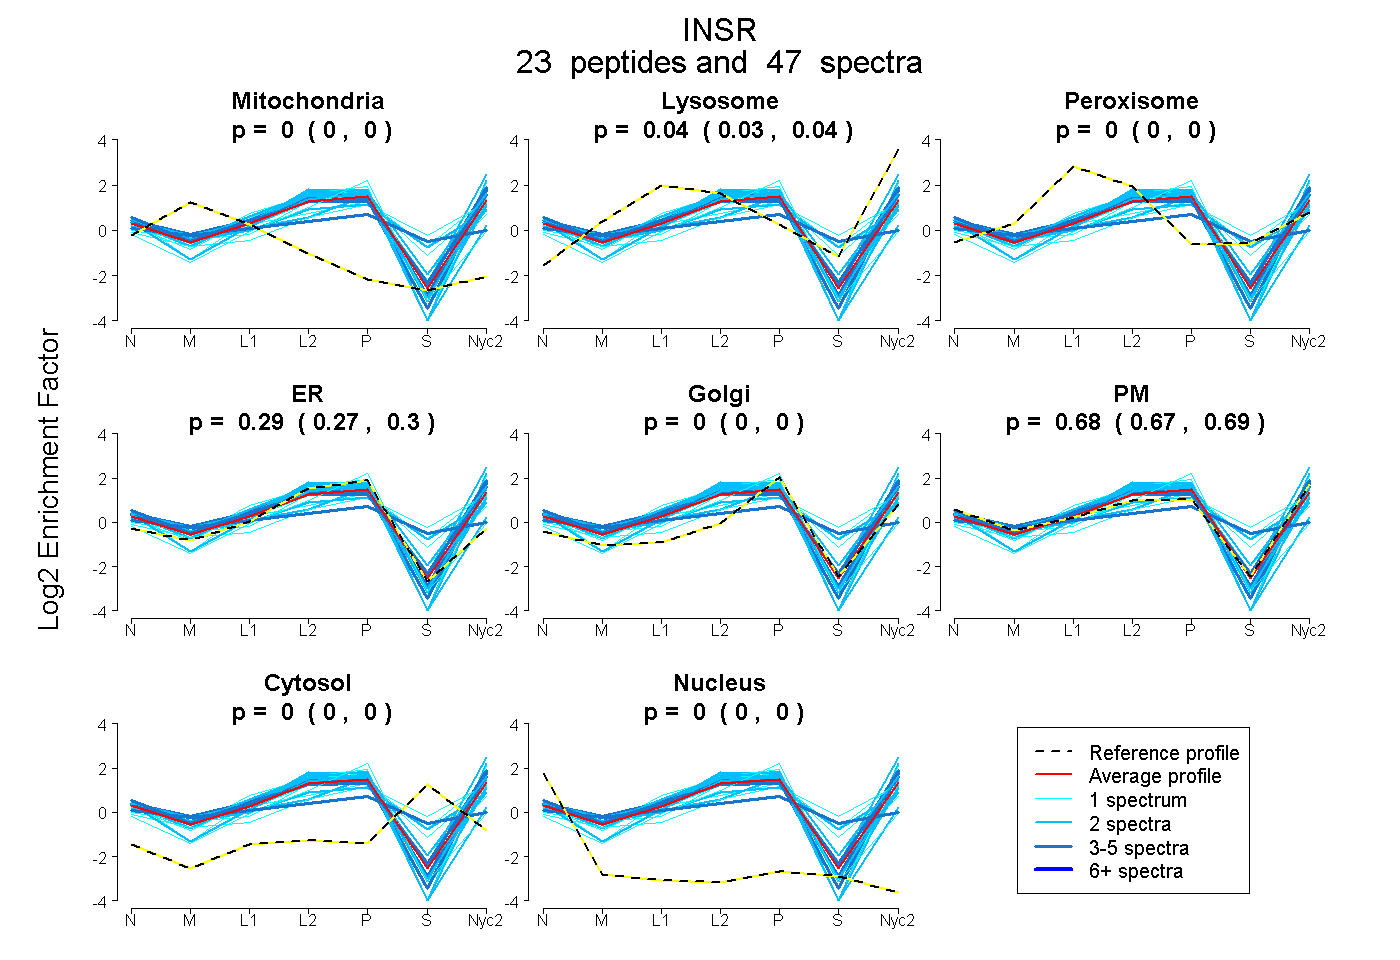
0.000 | 0.000
0.027 | 0.041
0.000 | 0.000
0.273 | 0.297
0.000 | 0.000
0.666 | 0.691
0.000 | 0.000
0.000 | 0.000
2peptides
spectra
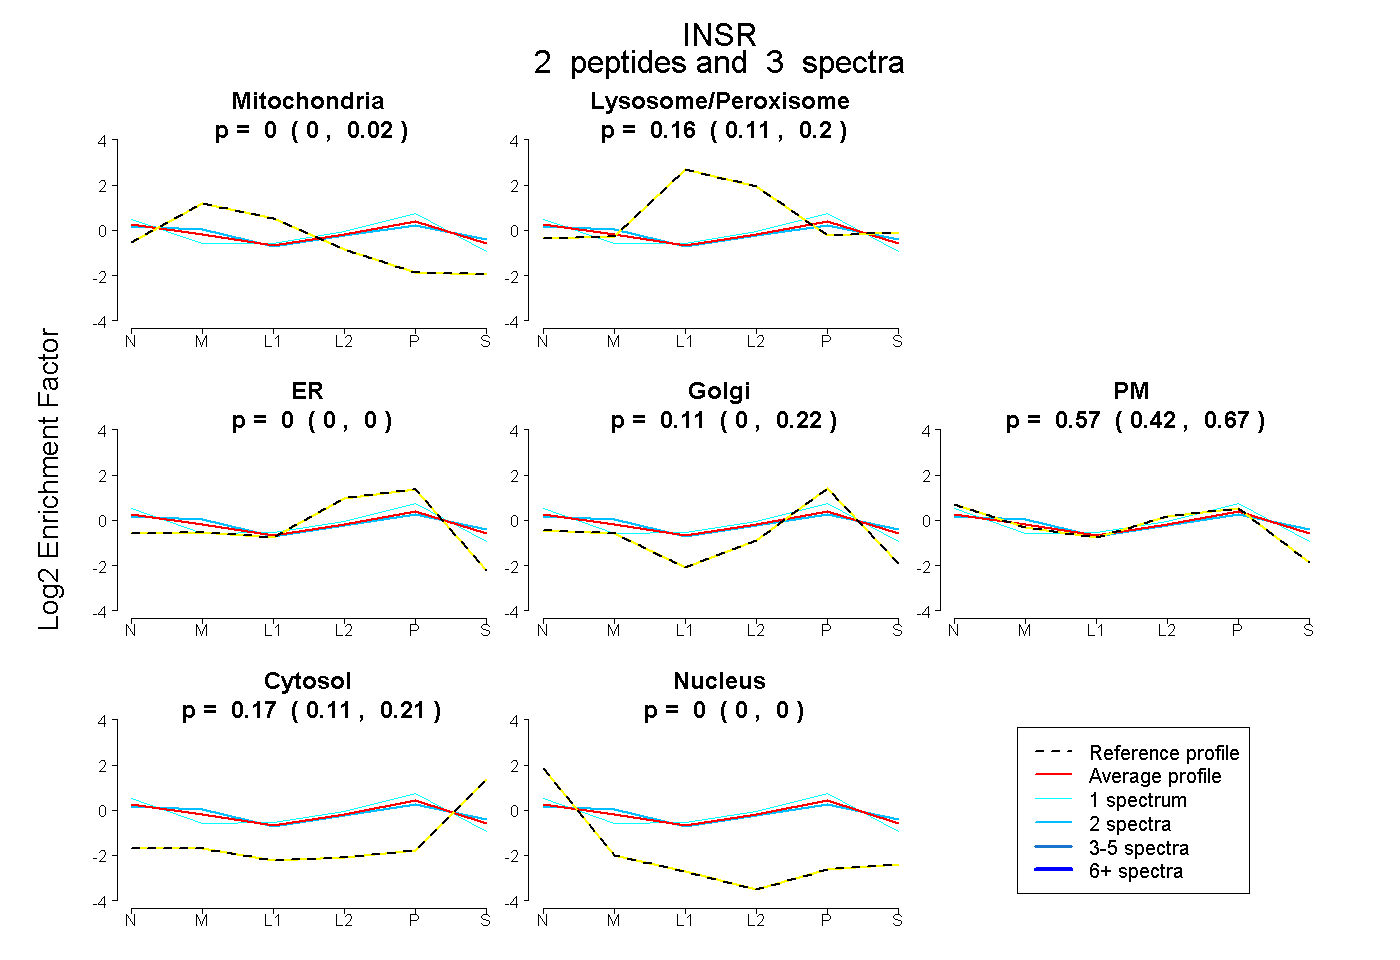
0.000 | 0.021
0.105 | 0.201
0.000 | 0.000
0.000 | 0.222
0.418 | 0.673
0.111 | 0.207
0.000 | 0.000
23peptides
spectra
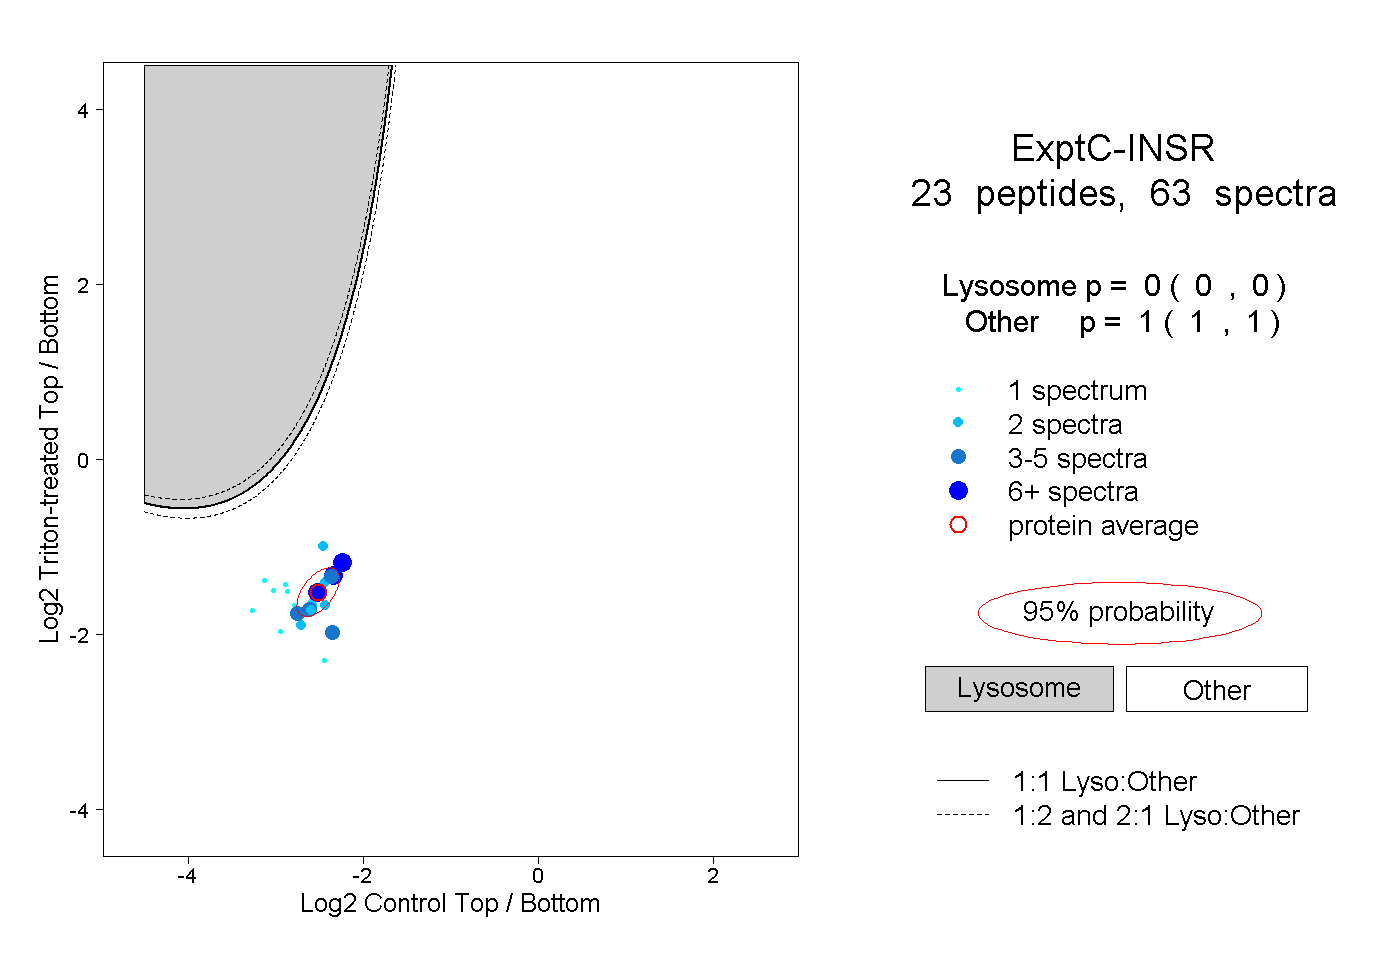
0.000 | 0.000
1.000 | 1.000
6peptides
spectra
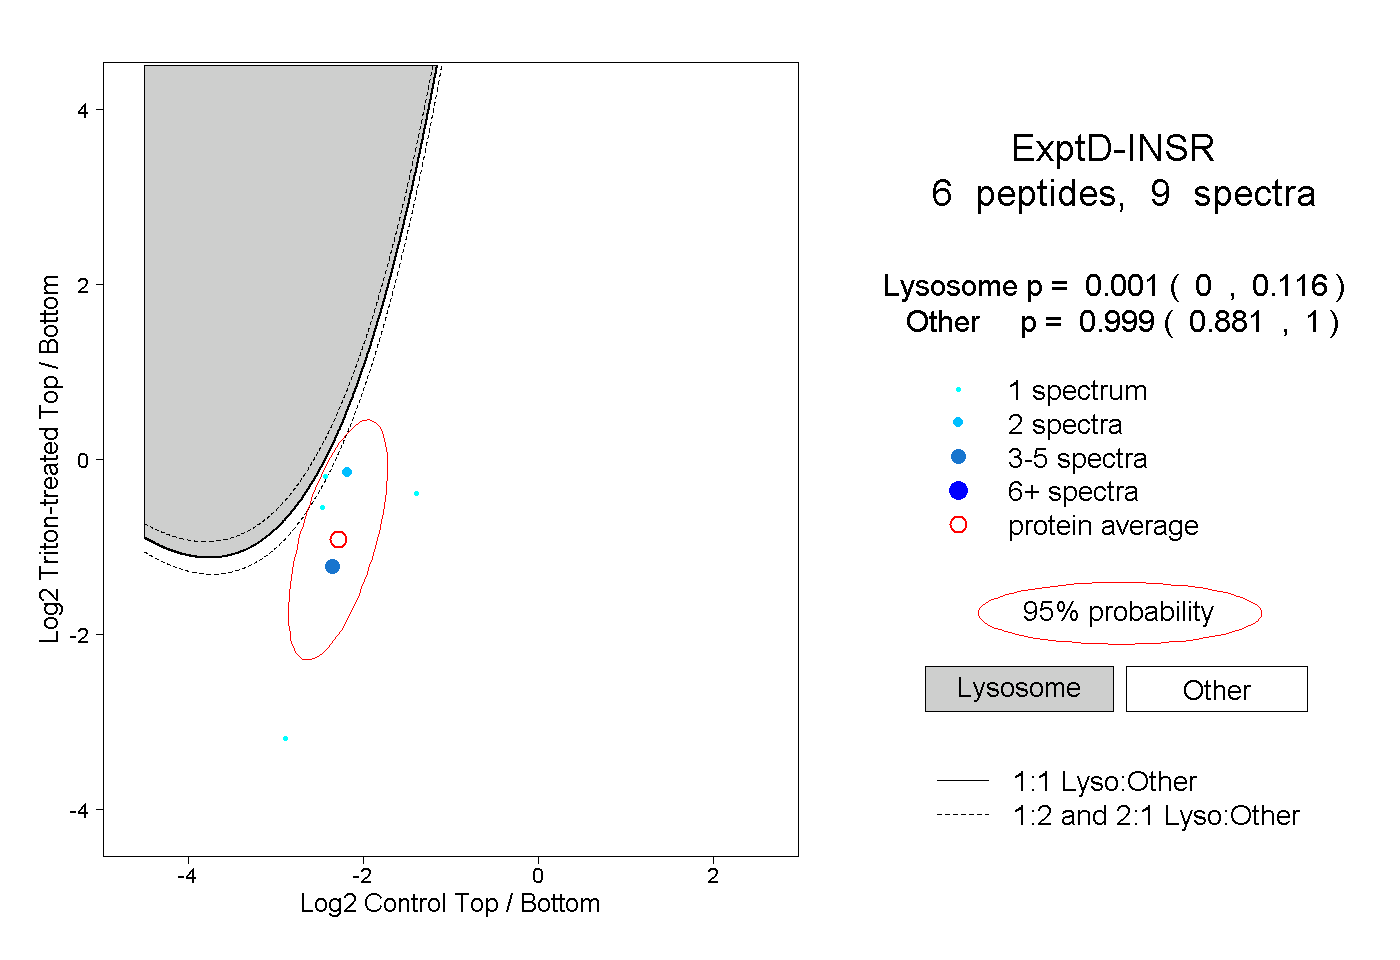
0.000 | 0.116
0.881 | 1.000