 19
19peptides
spectra
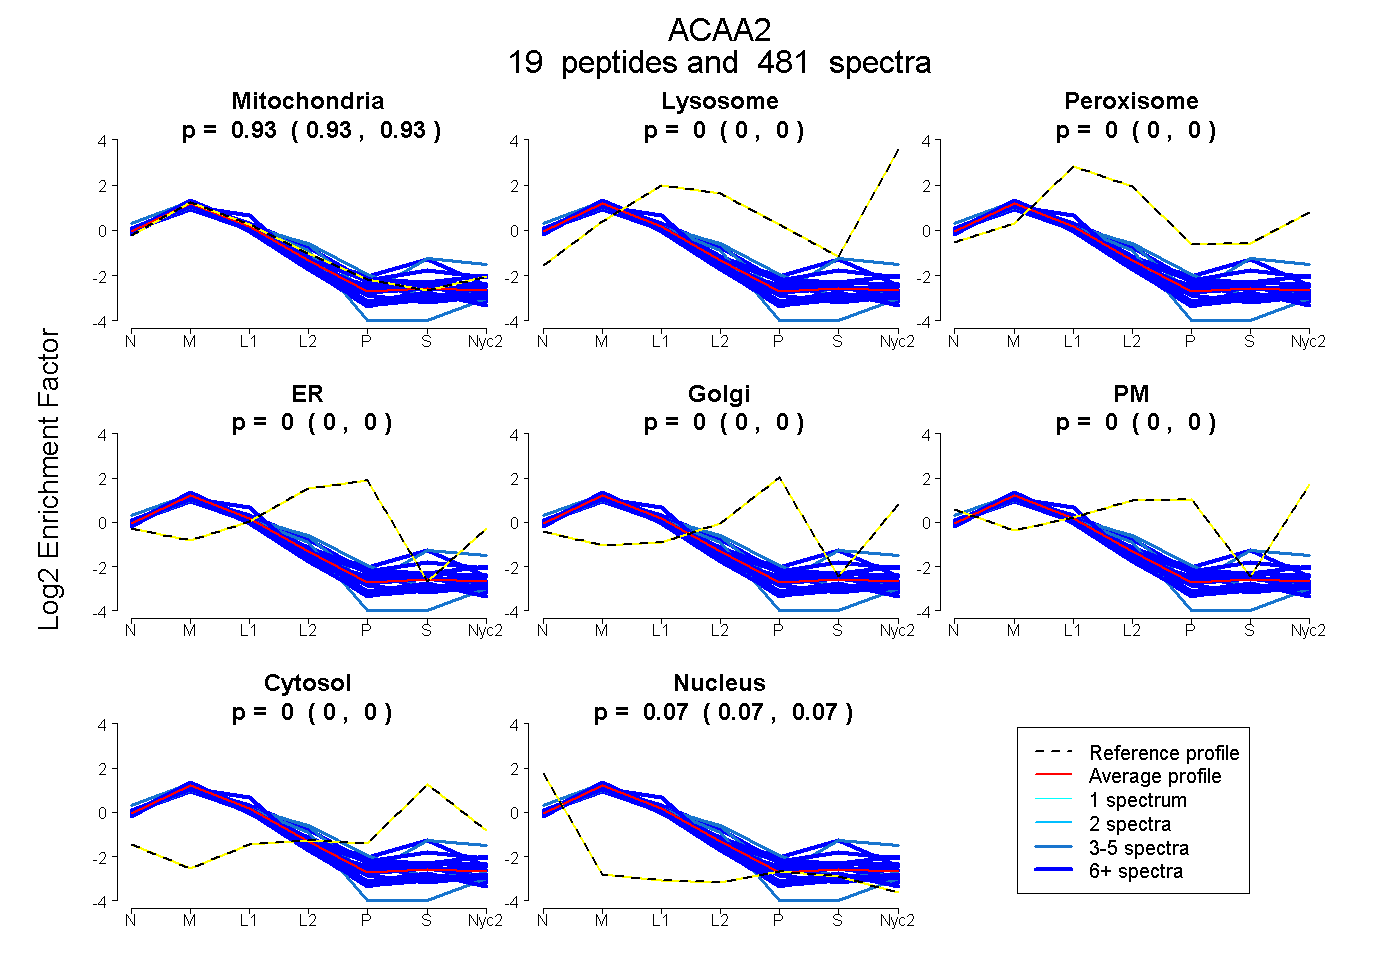
0.928 | 0.929
0.000 | 0.000
0.000 | 0.000
0.000 | 0.000
0.000 | 0.000
0.000 | 0.000
0.000 | 0.000
0.071 | 0.072
18peptides
spectra
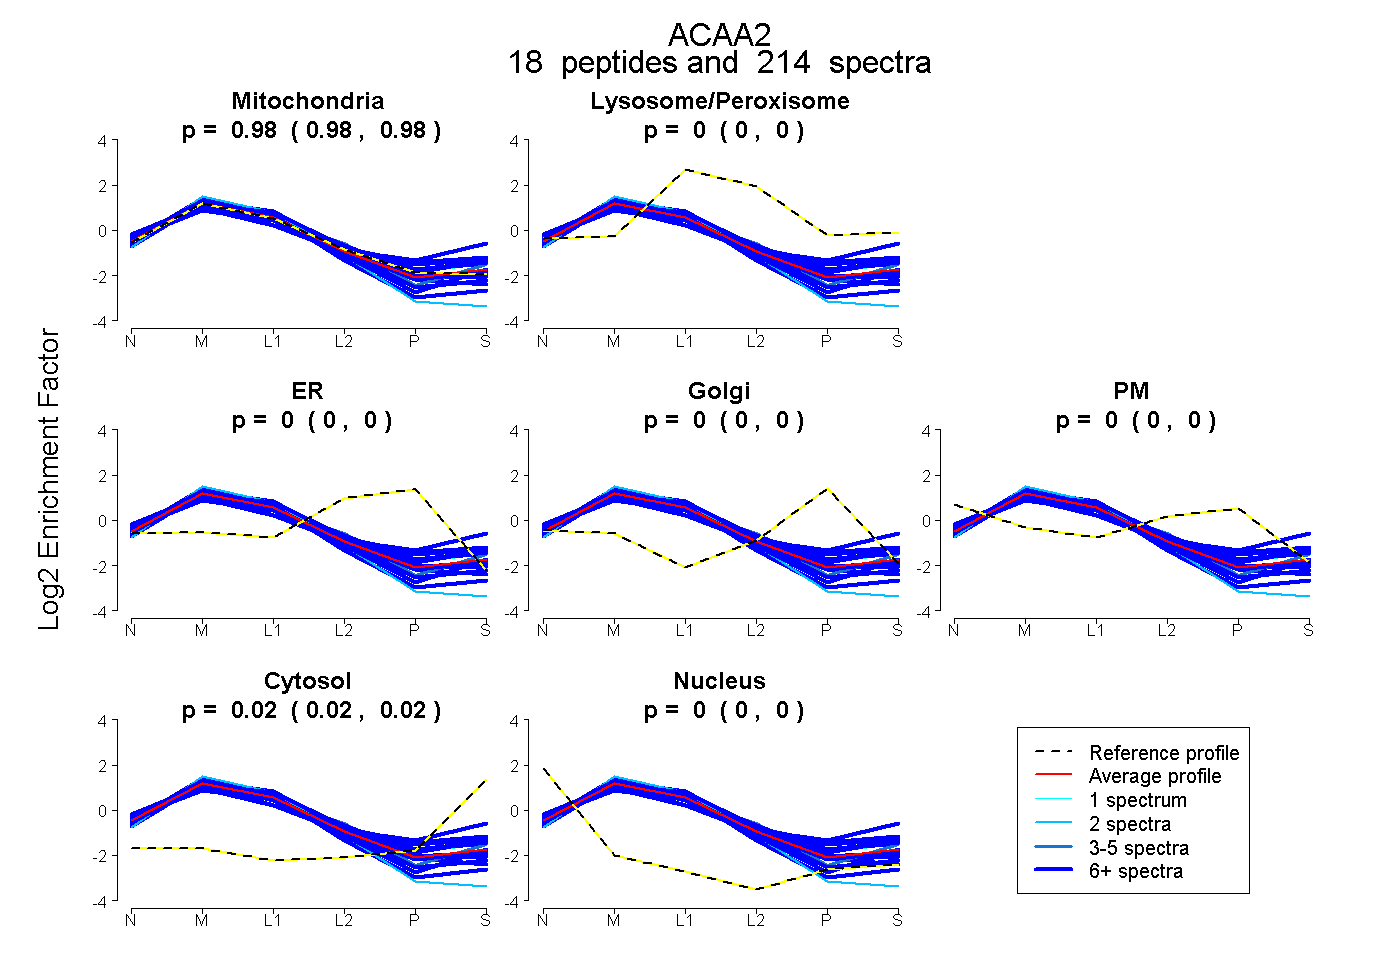
0.975 | 0.978
0.000 | 0.000
0.000 | 0.000
0.000 | 0.000
0.000 | 0.000
0.017 | 0.023
0.001 | 0.005
21peptides
spectra
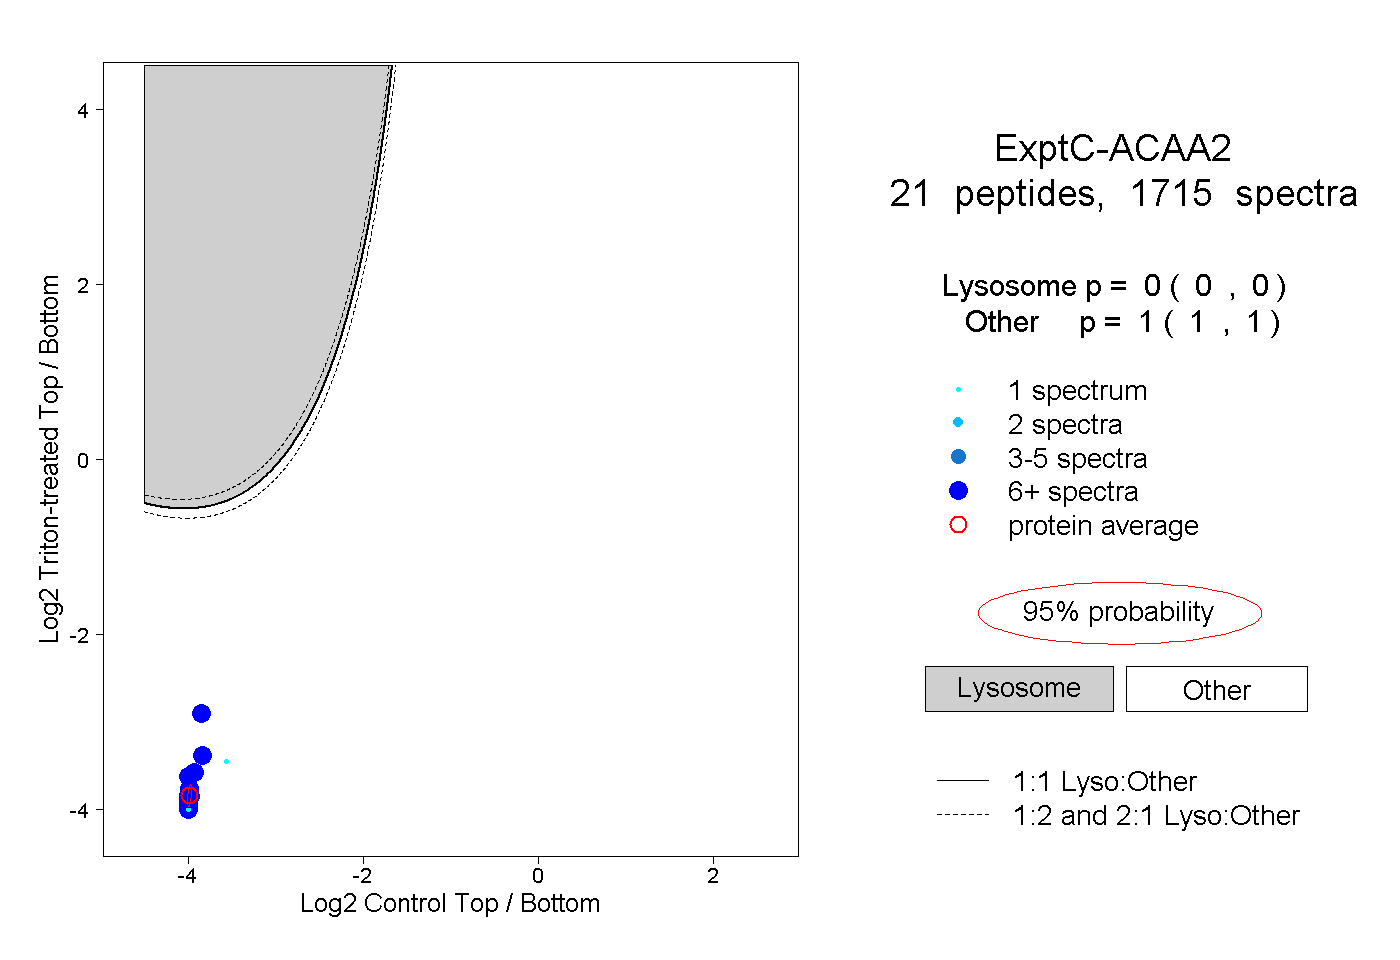
0.000 | 0.000
1.000 | 1.000
17peptides
spectra
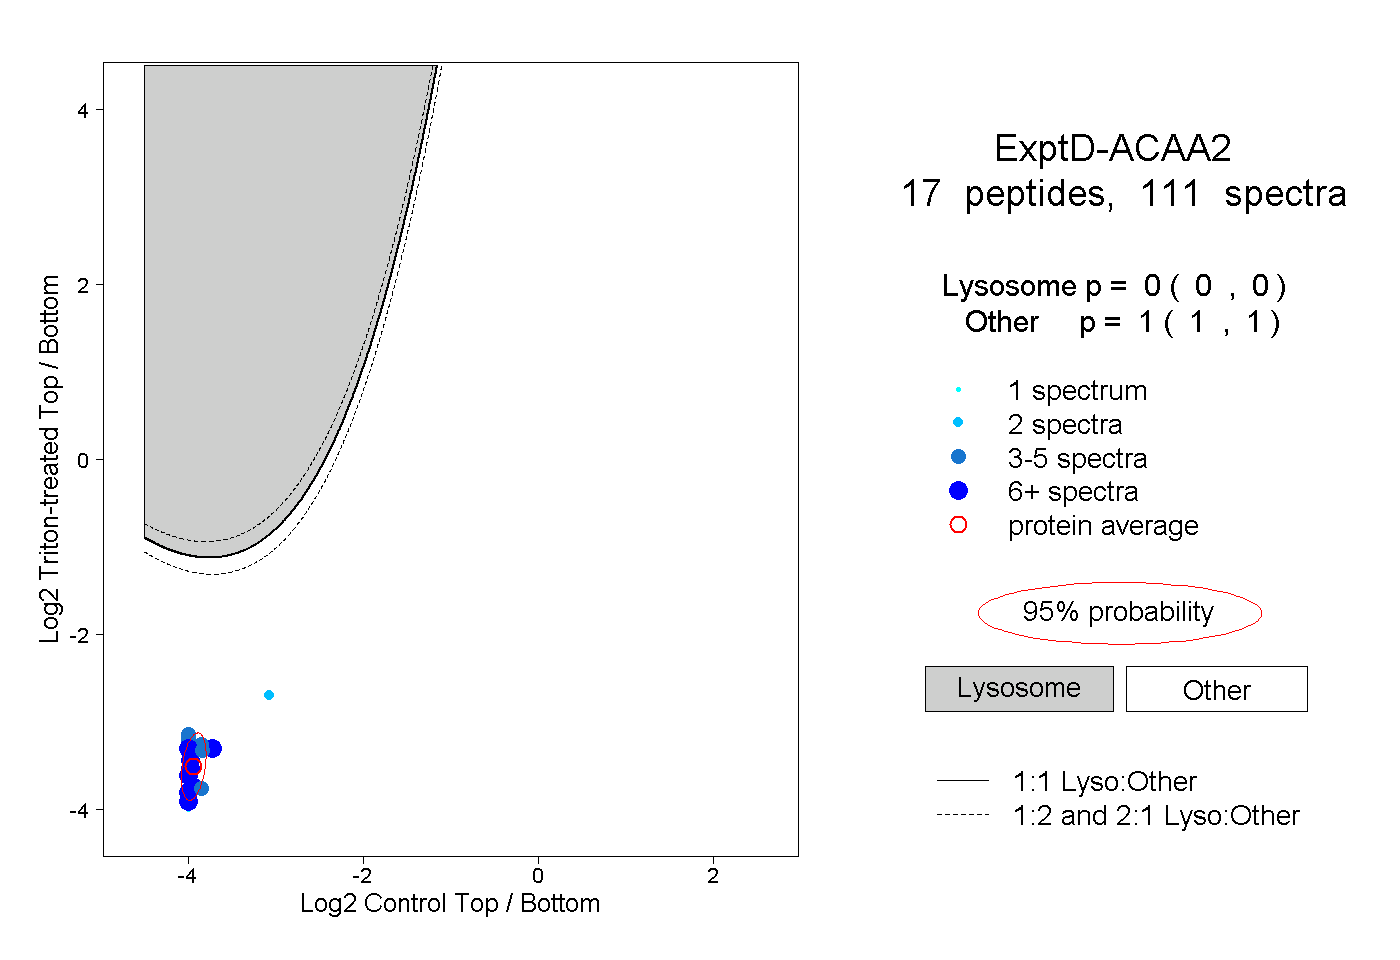
0.000 | 0.000
1.000 | 1.000