 14
14peptides
spectra
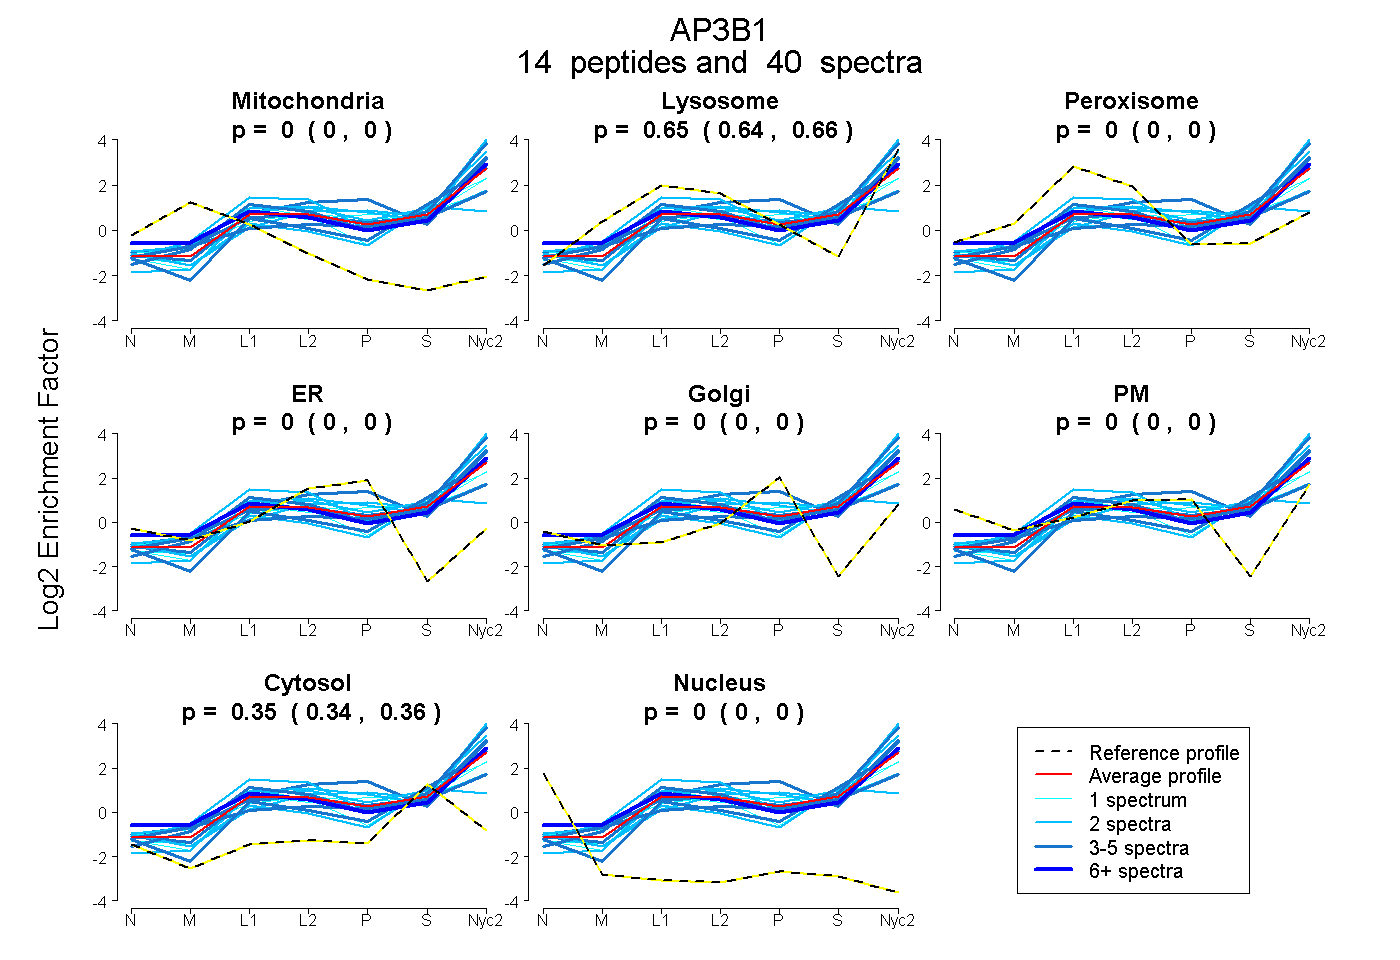
0.000 | 0.000
0.643 | 0.656
0.000 | 0.000
0.000 | 0.000
0.000 | 0.000
0.000 | 0.000
0.343 | 0.356
0.000 | 0.000
10peptides
spectra
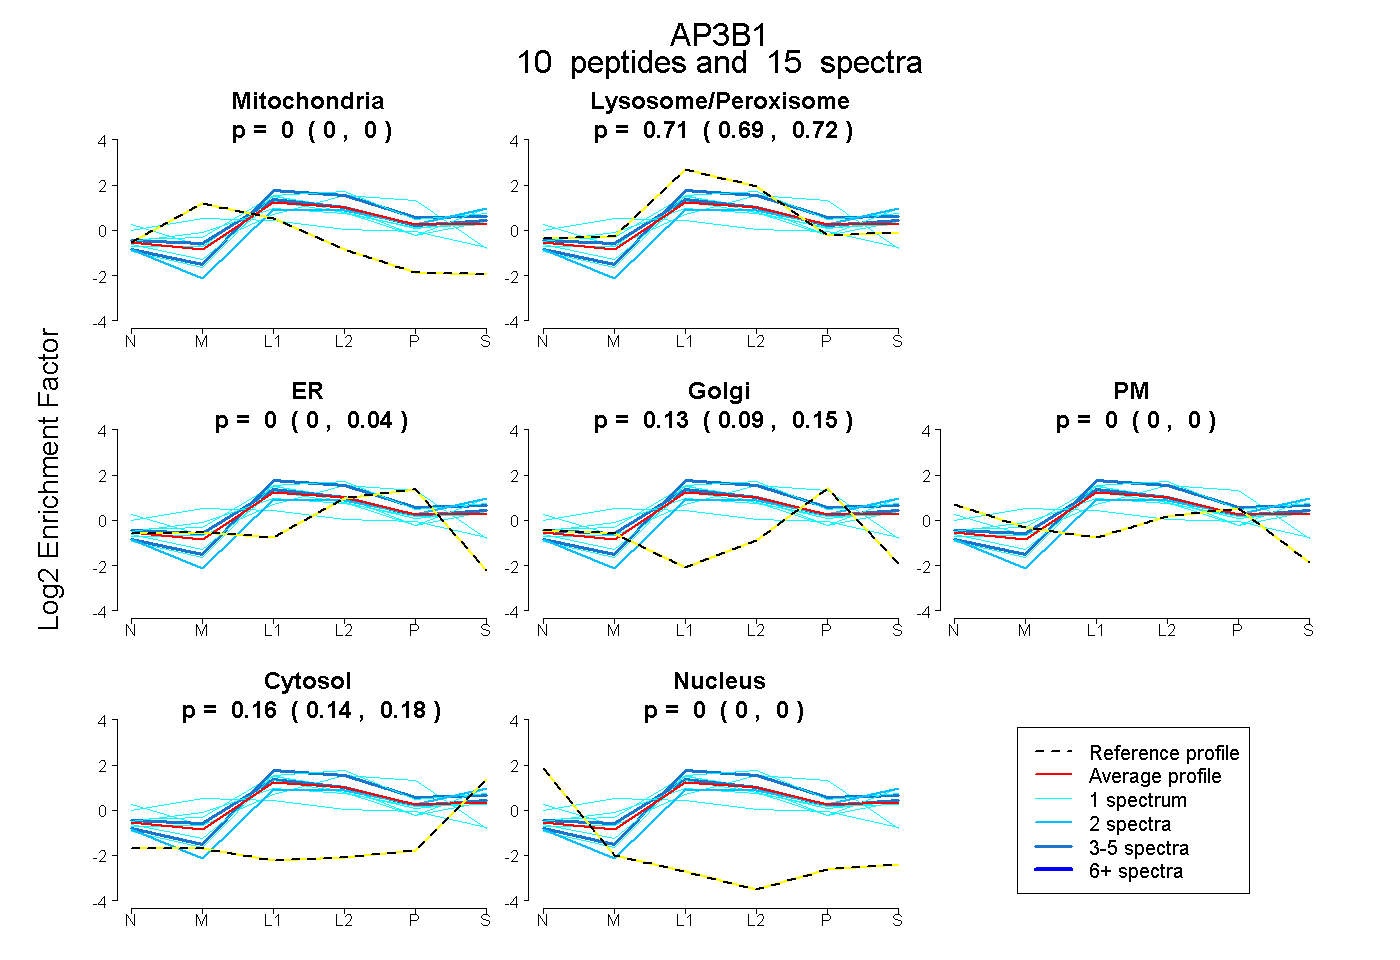
0.000 | 0.000
0.687 | 0.716
0.000 | 0.037
0.091 | 0.151
0.000 | 0.000
0.142 | 0.176
0.000 | 0.000
19peptides
spectra
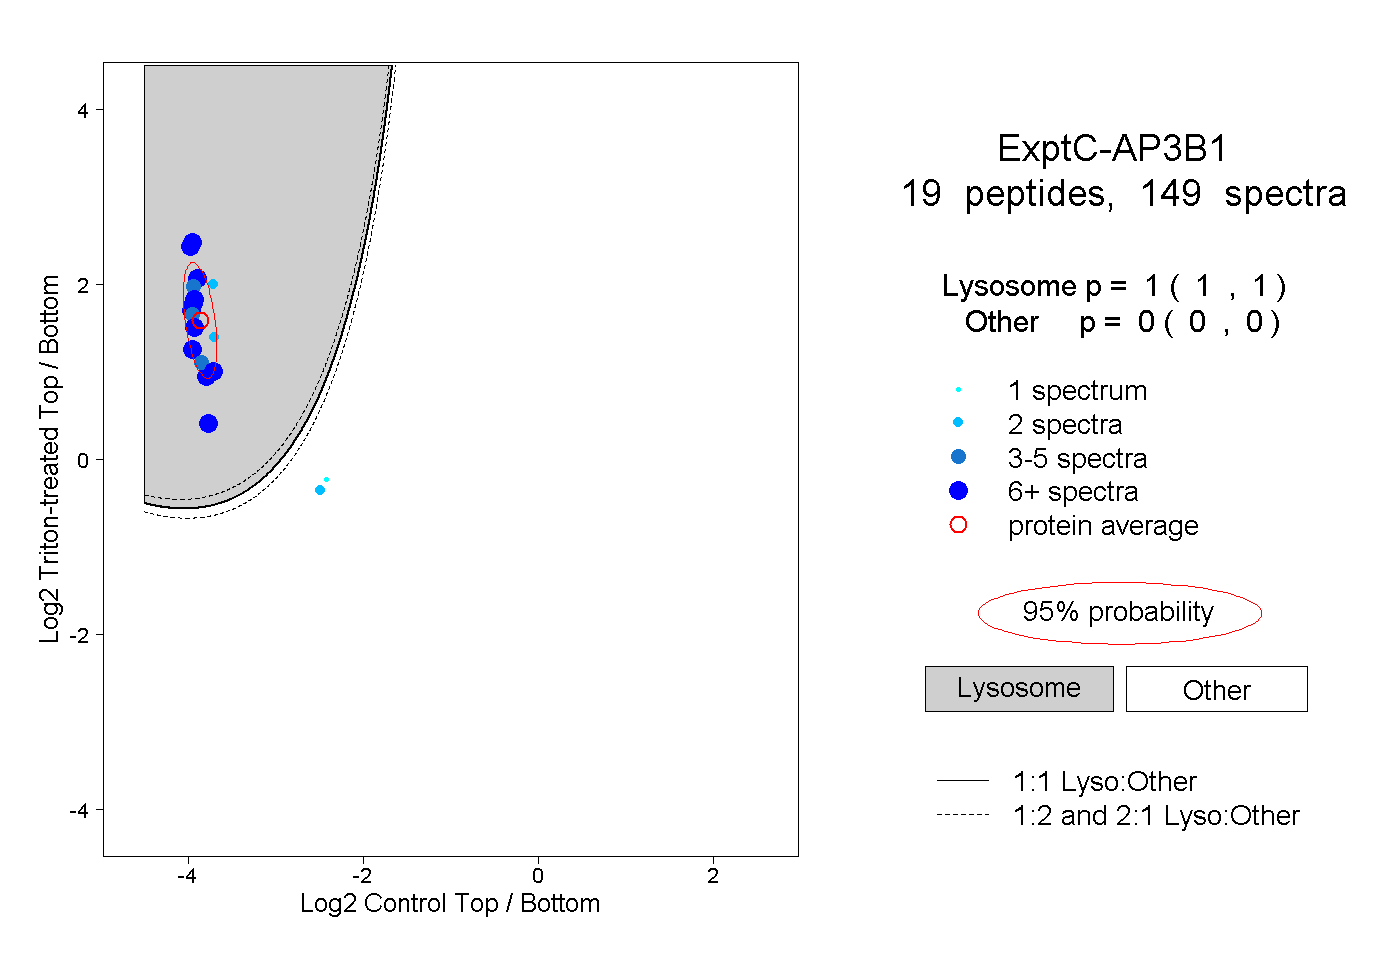
1.000 | 1.000
0.000 | 0.000
