AP3B1
[ENSRNOP00000060116]
Main page
| | | Plot |
Mito |
Lyso |
|
Perox |
ER |
Golgi |
PM |
Cytosol |
Nucleus |
|
| Expt A |
 14
14
peptides |
40
spectra |
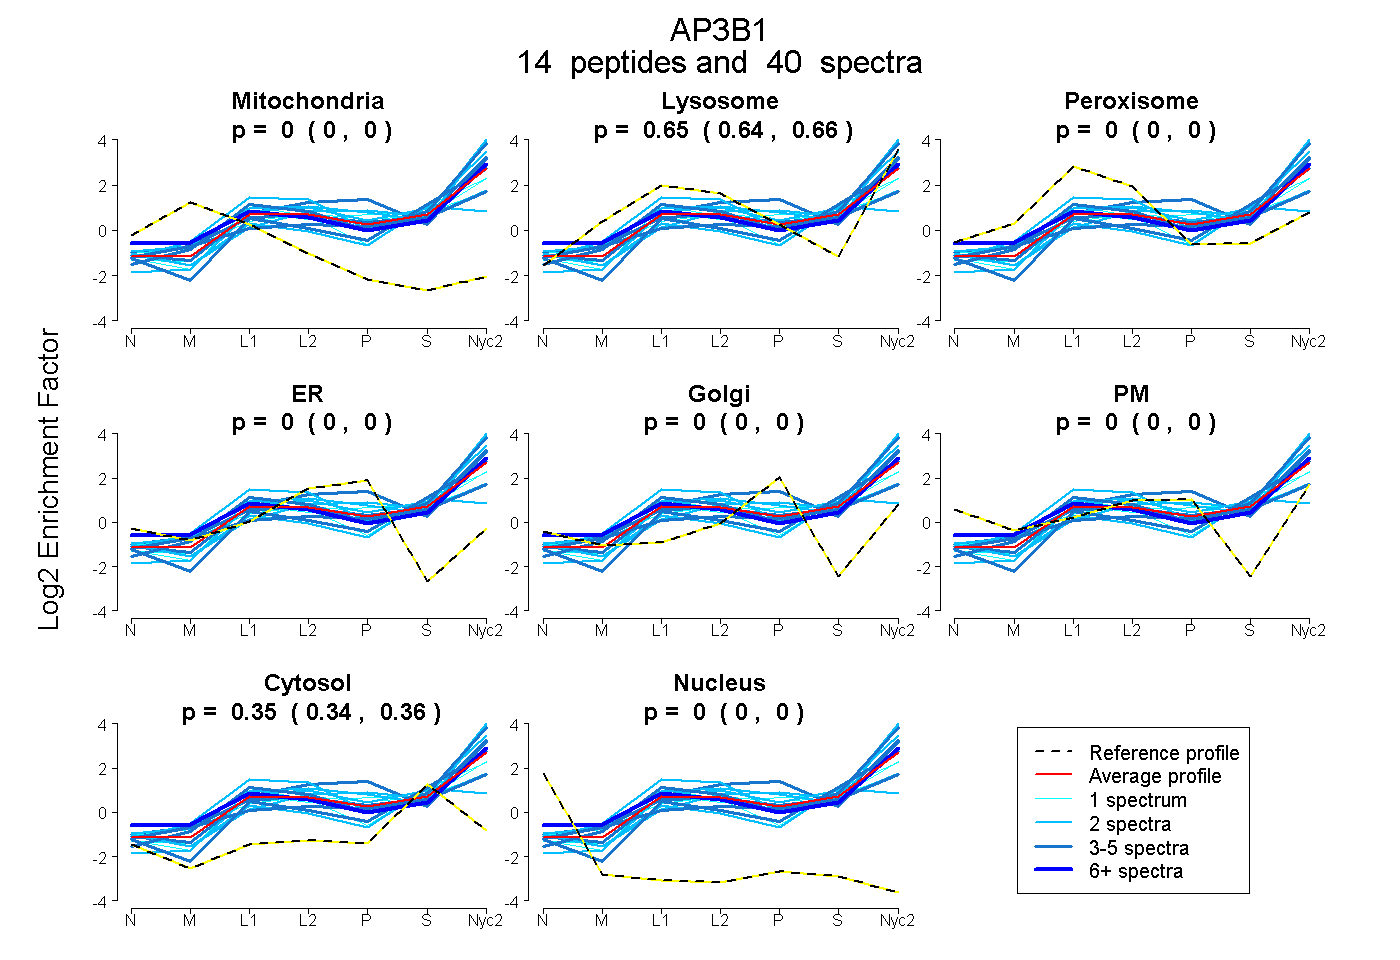 |
0.000
0.000 | 0.000 |
0.650
0.643 | 0.656 |
|
0.000
0.000 | 0.000 |
0.000
0.000 | 0.000 |
0.000
0.000 | 0.000 |
0.000
0.000 | 0.000 |
0.350
0.343 | 0.356 |
0.000
0.000 | 0.000 |
|
| | | Plot |
Mito |
|
Lyso or Perox |
|
ER |
Golgi |
PM |
Cytosol |
Nucleus |
|
| Expt B |
10
peptides |
15
spectra |
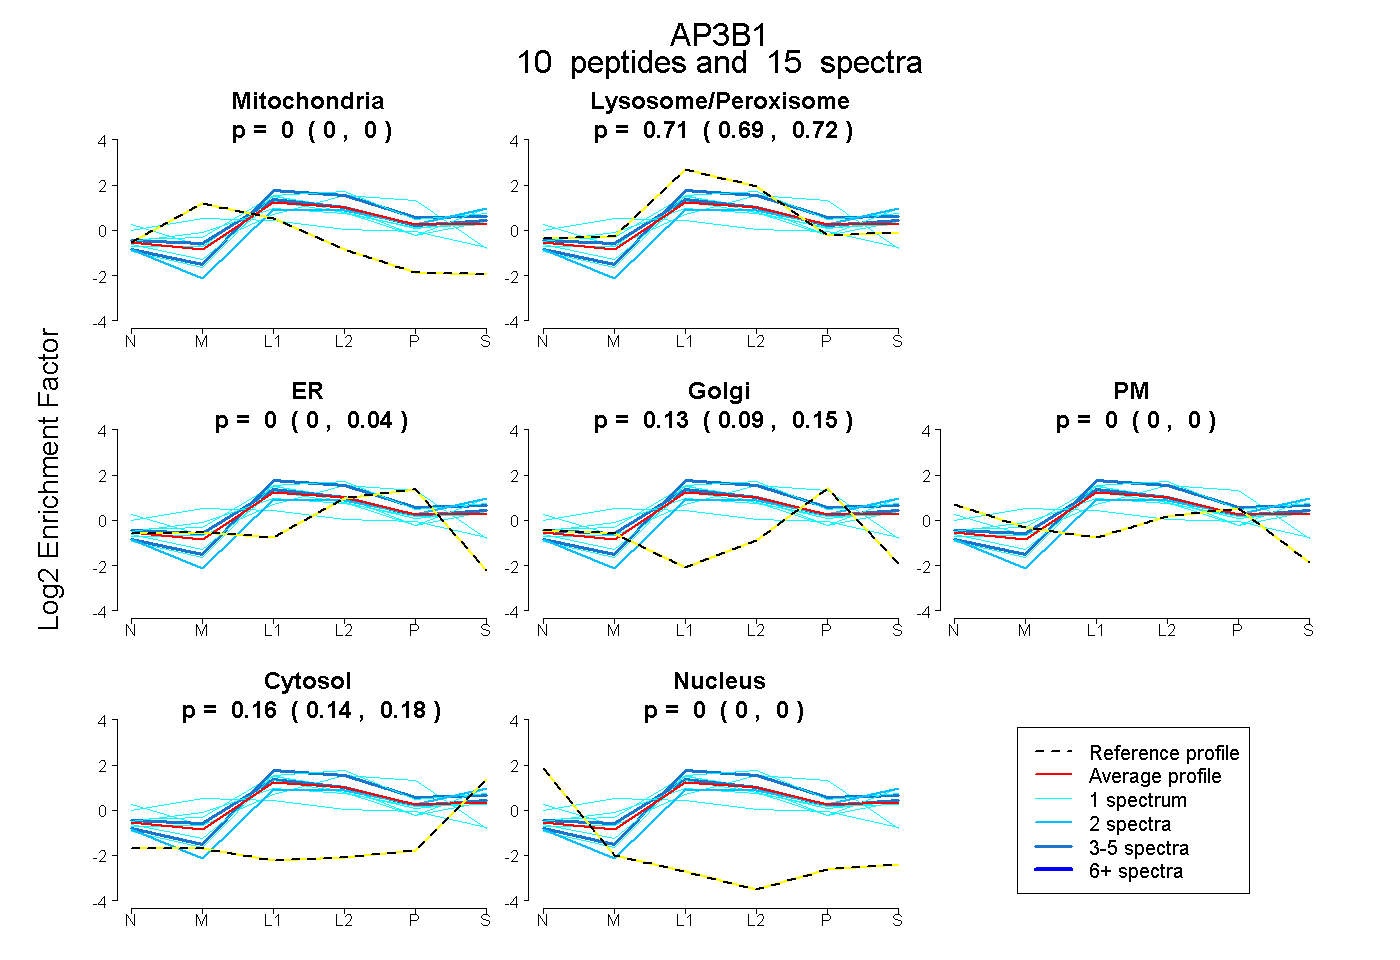 |
0.000
0.000 | 0.000 |
|
0.706
0.687 | 0.716 |
|
0.000
0.000 | 0.037 |
0.135
0.091 | 0.151 |
0.000
0.000 | 0.000 |
0.160
0.142 | 0.176 |
0.000
0.000 | 0.000 |
|
| 1 spectrum, QFAAATIQTIGR |
0.000 |
|
0.694 |
|
0.000 |
0.000 |
0.000 |
0.306 |
0.000 |
|
| 1 spectrum, EFQTYVR |
0.000 |
|
0.743 |
|
0.000 |
0.092 |
0.000 |
0.165 |
0.000 |
|
| 1 spectrum, IAPDVLR |
0.000 |
|
0.427 |
|
0.572 |
0.000 |
0.000 |
0.000 |
0.000 |
|
| 1 spectrum, SFTSEDDLVK |
0.000 |
|
0.761 |
|
0.066 |
0.000 |
0.000 |
0.173 |
0.000 |
|
| 2 spectra, TVIGSVLLR |
0.000 |
|
0.620 |
|
0.040 |
0.000 |
0.000 |
0.339 |
0.000 |
|
| 3 spectra, LYLTNSK |
0.000 |
|
0.733 |
|
0.000 |
0.110 |
0.000 |
0.158 |
0.000 |
|
| 3 spectra, LQILNLGAK |
0.000 |
|
0.782 |
|
0.065 |
0.000 |
0.000 |
0.153 |
0.000 |
|
| 1 spectrum, NVEVIESAK |
0.000 |
|
0.660 |
|
0.000 |
0.183 |
0.000 |
0.156 |
0.000 |
|
| 1 spectrum, LLTQYILNLGK |
0.000 |
|
0.740 |
|
0.000 |
0.000 |
0.082 |
0.136 |
0.042 |
|
| 1 spectrum, THELLHR |
0.269 |
|
0.326 |
|
0.000 |
0.149 |
0.215 |
0.041 |
0.000 |
|
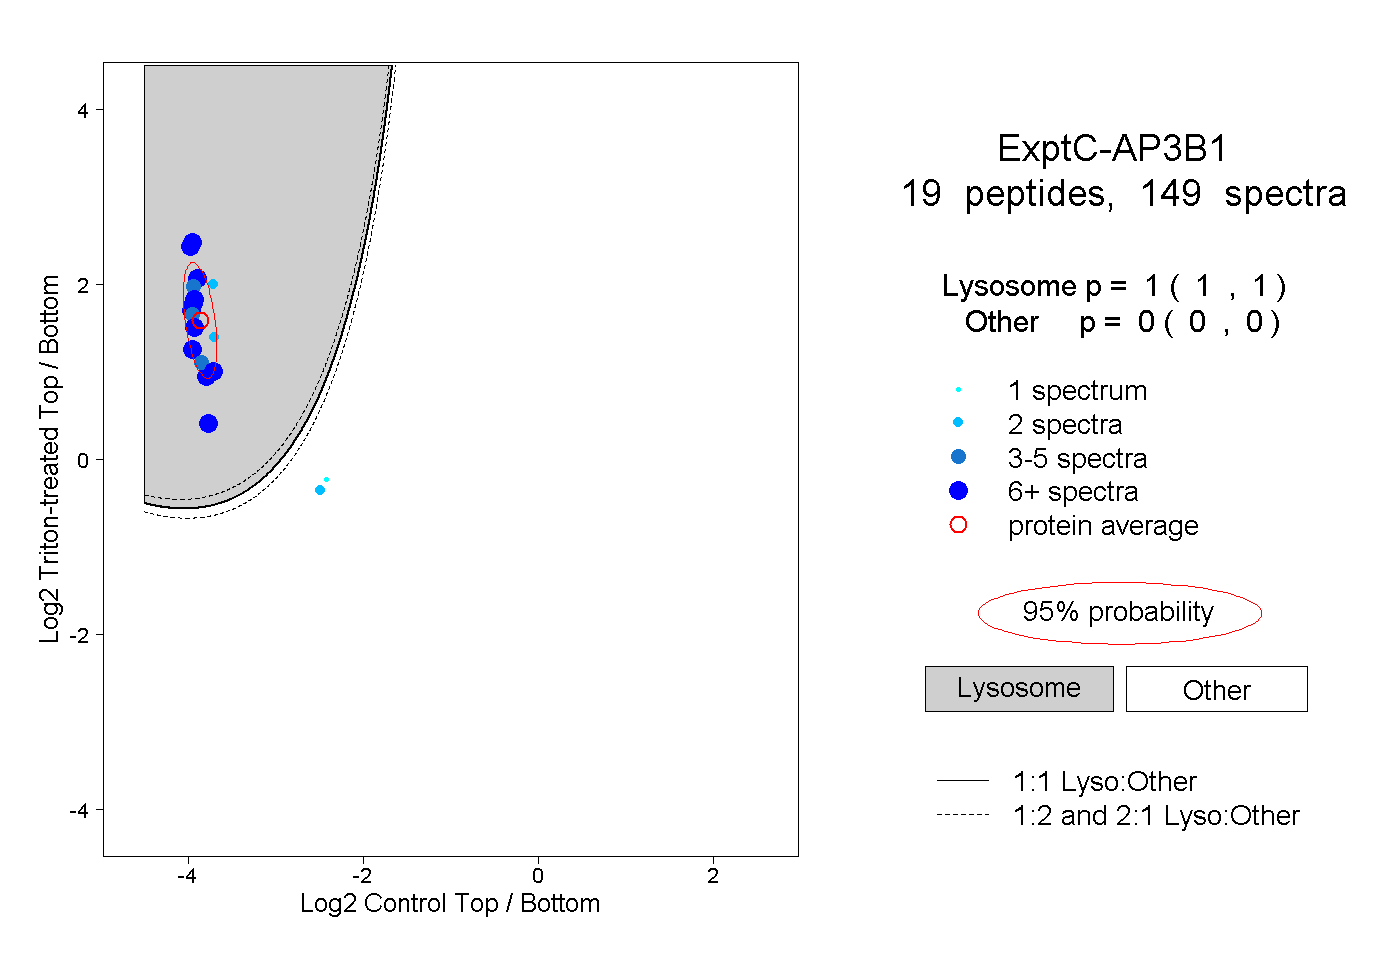
| | | Plot |
|
Lyso |
|
|
|
|
|
|
|
Other |
| Expt C |
19
peptides |
149
spectra |
 |
|
1.000
1.000 | 1.000 |
|
|
|
|
|
|
|
0.000
0.000 | 0.000 |
| | | Plot |
|
Lyso |
|
|
|
|
|
|
|
Other |
| Expt D |
8
peptides |
8
spectra |
 |
|
0.999
0.814 | 1.000 |
|
|
|
|
|
|
|
0.001
0.000 | 0.183 |