 14
14peptides
spectra
0.000 | 0.000
0.643 | 0.656
0.000 | 0.000
0.000 | 0.000
0.000 | 0.000
0.000 | 0.000
0.343 | 0.356
0.000 | 0.000
| Plot | Mito | Lyso | Perox | ER | Golgi | PM | Cytosol | Nucleus | |||||
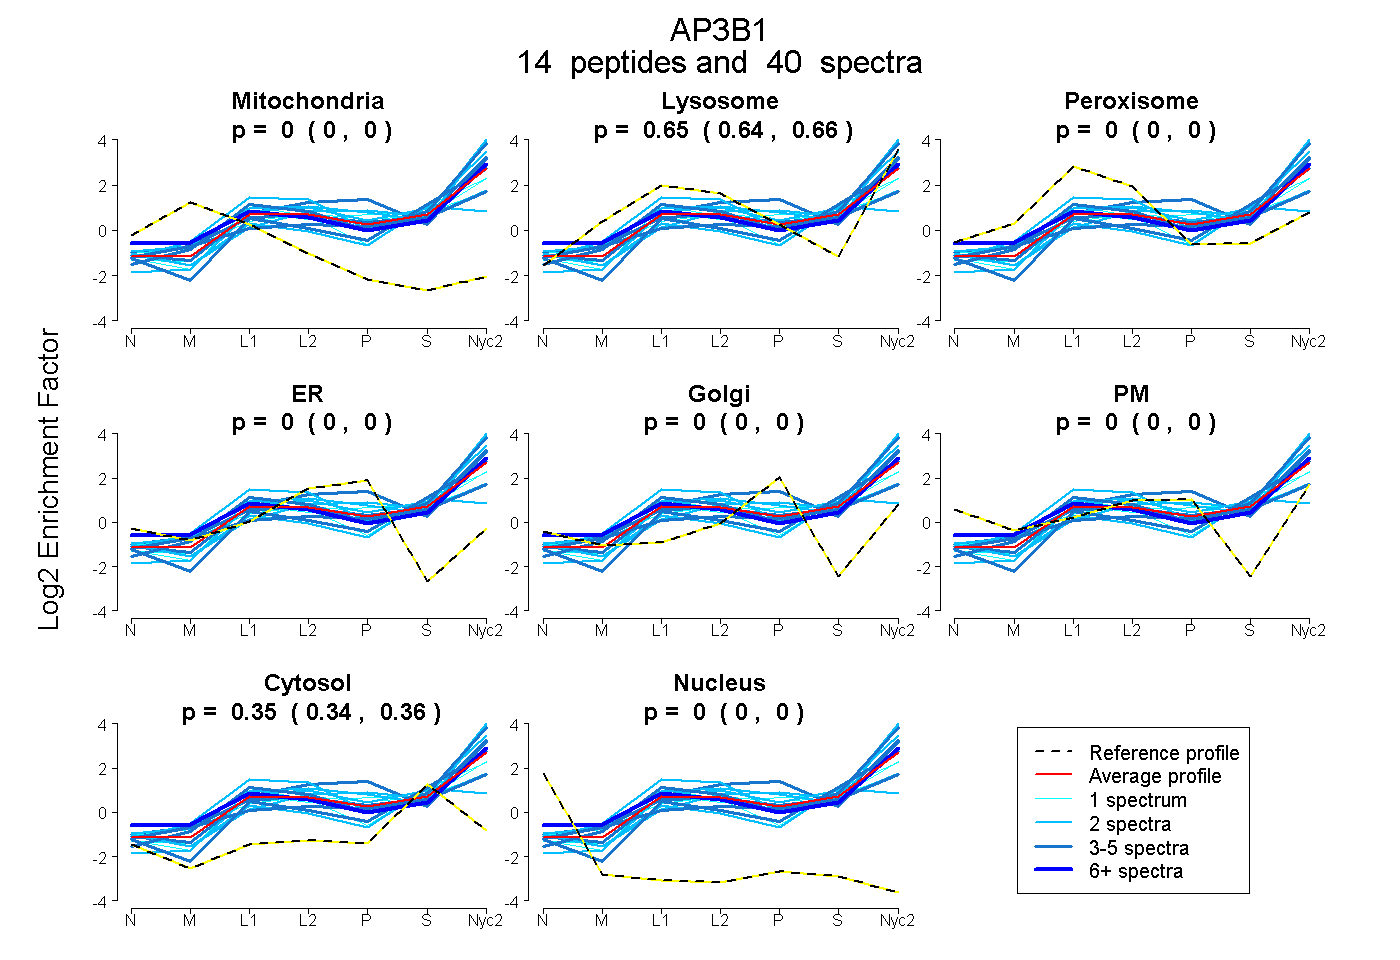
| Expt A |
14 peptides |
40 spectra |
|
0.000 0.000 | 0.000 |
0.650 0.643 | 0.656 |
0.000 0.000 | 0.000 |
0.000 0.000 | 0.000 |
0.000 0.000 | 0.000 |
0.000 0.000 | 0.000 |
0.350 0.343 | 0.356 |
0.000 0.000 | 0.000 |
| 1 spectrum, DHFQLGTLSHTLNVK | 0.000 | 0.543 | 0.000 | 0.000 | 0.033 | 0.000 | 0.424 | 0.000 | ||
| 2 spectra, LLDSITVPVAR | 0.000 | 0.856 | 0.000 | 0.000 | 0.000 | 0.000 | 0.144 | 0.000 | ||
| 11 spectra, YDQNYDIR | 0.000 | 0.690 | 0.000 | 0.000 | 0.000 | 0.009 | 0.301 | 0.000 | ||
| 2 spectra, LQILNLGAK | 0.000 | 0.698 | 0.000 | 0.000 | 0.000 | 0.000 | 0.302 | 0.000 | ||
| 4 spectra, EFQTYVR | 0.000 | 0.707 | 0.000 | 0.000 | 0.000 | 0.000 | 0.293 | 0.000 | ||
| 3 spectra, IAPDVLR | 0.000 | 0.677 | 0.000 | 0.000 | 0.148 | 0.000 | 0.175 | 0.000 | ||
| 3 spectra, SFTSEDDLVK | 0.000 | 0.769 | 0.000 | 0.000 | 0.000 | 0.000 | 0.231 | 0.000 | ||
| 3 spectra, TVIGSVLLR | 0.000 | 0.515 | 0.000 | 0.000 | 0.000 | 0.000 | 0.485 | 0.000 | ||
| 1 spectrum, IENIHVGGK | 0.000 | 0.609 | 0.000 | 0.000 | 0.032 | 0.000 | 0.359 | 0.000 | ||
| 1 spectrum, ASGYLELSNWPEVAPDPSVR | 0.000 | 0.563 | 0.000 | 0.000 | 0.000 | 0.000 | 0.437 | 0.000 | ||
| 2 spectra, NVEVIESAK | 0.000 | 0.463 | 0.000 | 0.000 | 0.157 | 0.000 | 0.380 | 0.000 | ||
| 2 spectra, GLAAHYCFPR | 0.000 | 0.268 | 0.139 | 0.000 | 0.000 | 0.000 | 0.592 | 0.000 | ||
| 2 spectra, LLQMQPAQHGEIIK | 0.000 | 0.827 | 0.000 | 0.000 | 0.000 | 0.000 | 0.173 | 0.000 | ||
| 3 spectra, THELLHR | 0.000 | 0.512 | 0.000 | 0.000 | 0.051 | 0.000 | 0.437 | 0.000 |
| Plot | Mito | Lyso or Perox | ER | Golgi | PM | Cytosol | Nucleus | ||||||
| Expt B |
10 peptides |
15 spectra |
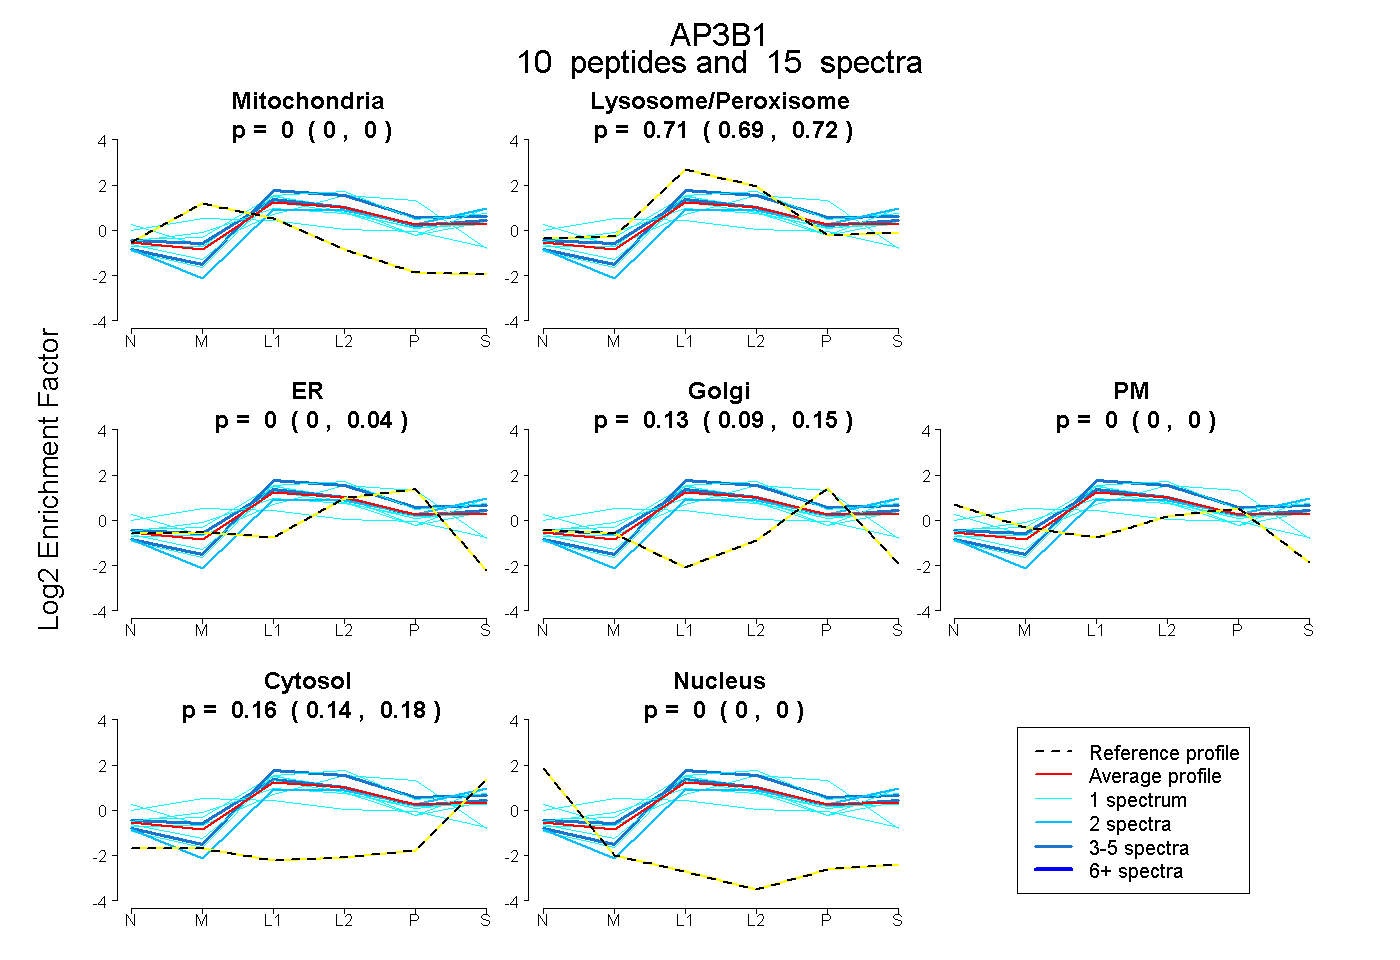 |
0.000 0.000 | 0.000 |
0.706 0.687 | 0.716 |
0.000 0.000 | 0.037 |
0.135 0.091 | 0.151 |
0.000 0.000 | 0.000 |
0.160 0.142 | 0.176 |
0.000 0.000 | 0.000 |
|||
| Plot | Lyso | Other | |||||||||||
| Expt C |
19 peptides |
149 spectra |
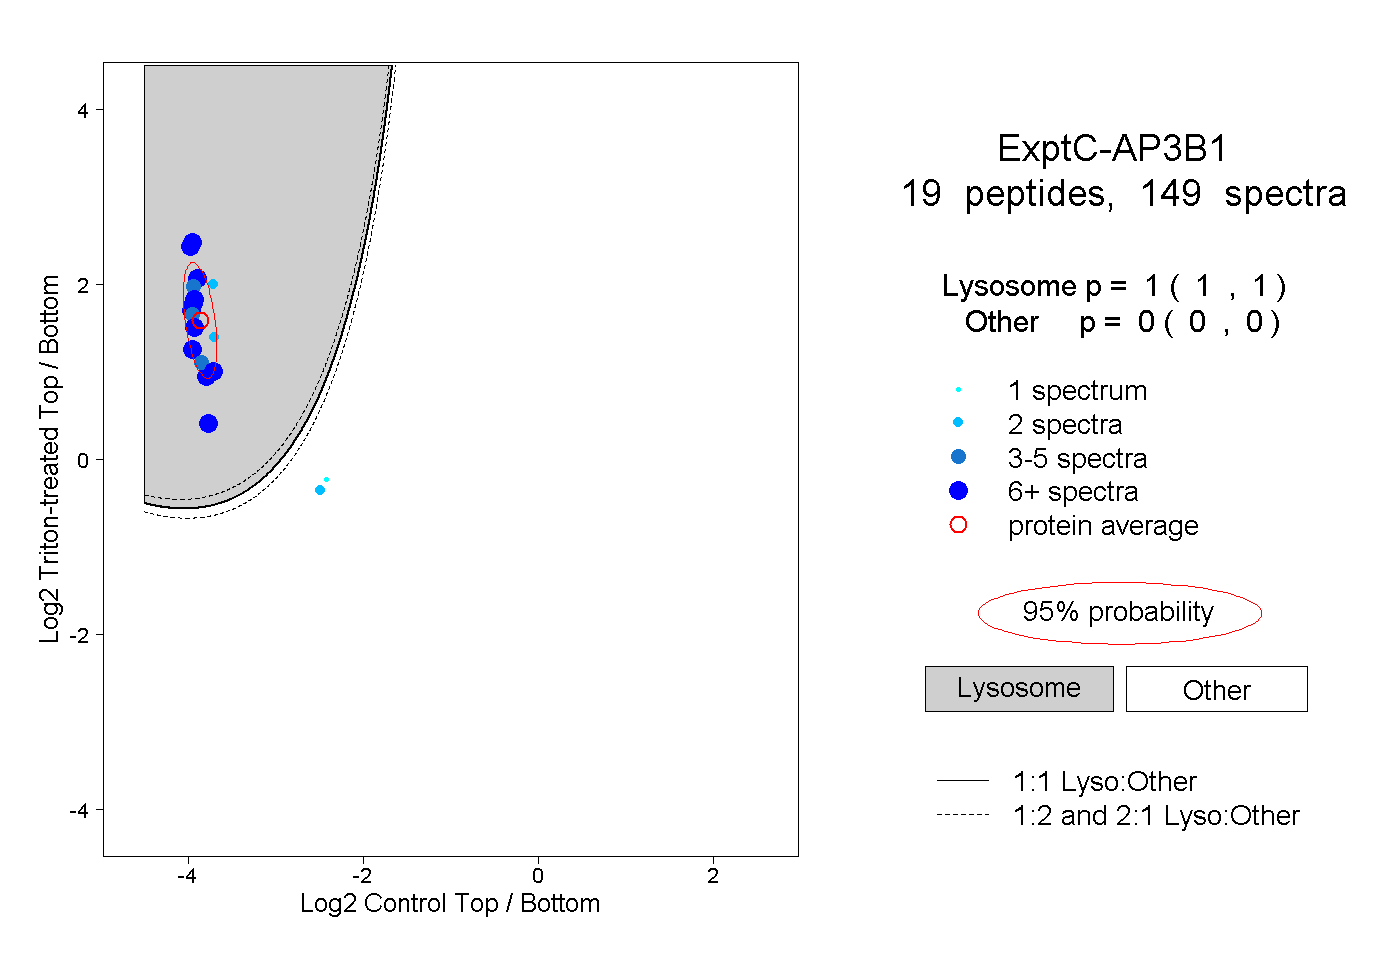 |
1.000 1.000 | 1.000 |
0.000 0.000 | 0.000 |
||||||||
| Plot | Lyso | Other | |||||||||||
| Expt D |
8 peptides |
8 spectra |
 |
0.999 0.814 | 1.000 |
0.001 0.000 | 0.183 |