10
10peptides
spectra
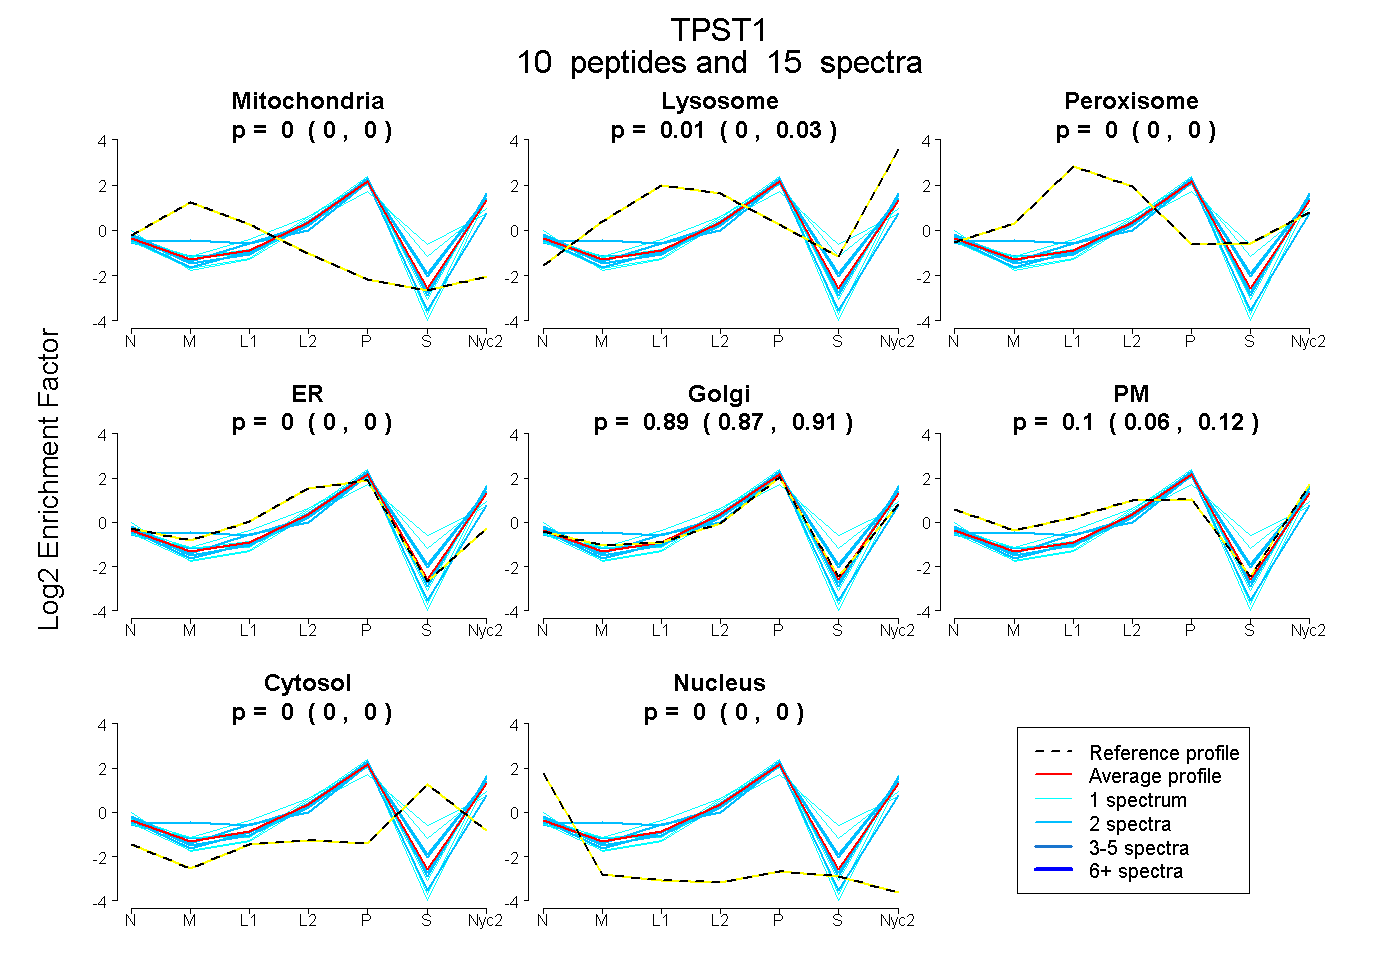
0.000 | 0.000
0.000 | 0.029
0.000 | 0.000
0.000 | 0.000
0.871 | 0.907
0.063 | 0.122
0.000 | 0.000
0.000 | 0.000
4peptides
spectra
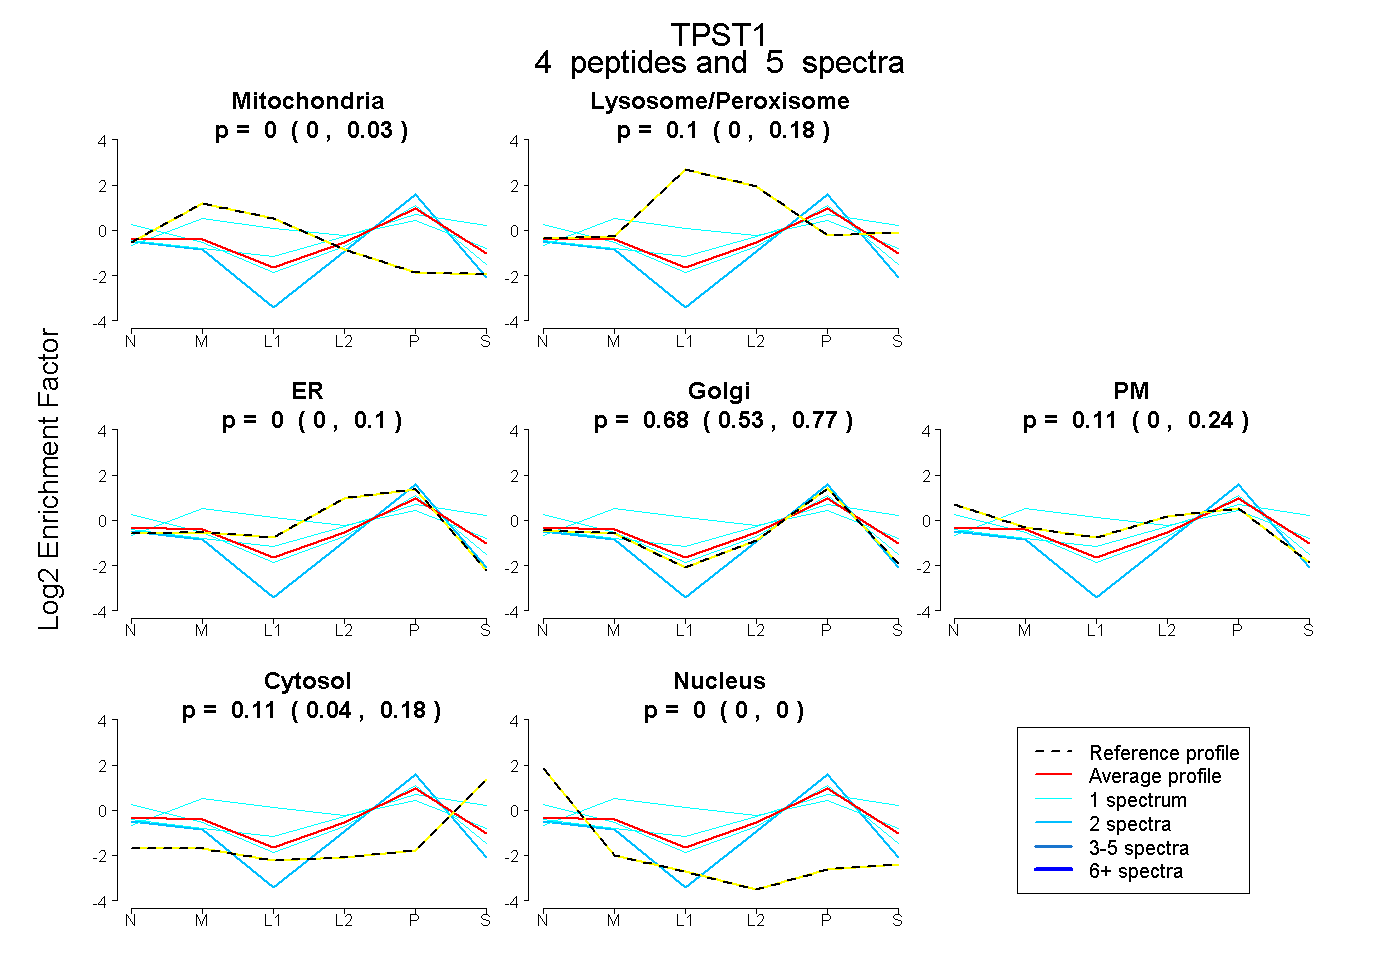
0.000 | 0.030
0.000 | 0.185
0.000 | 0.098
0.532 | 0.770
0.000 | 0.241
0.038 | 0.179
0.000 | 0.000
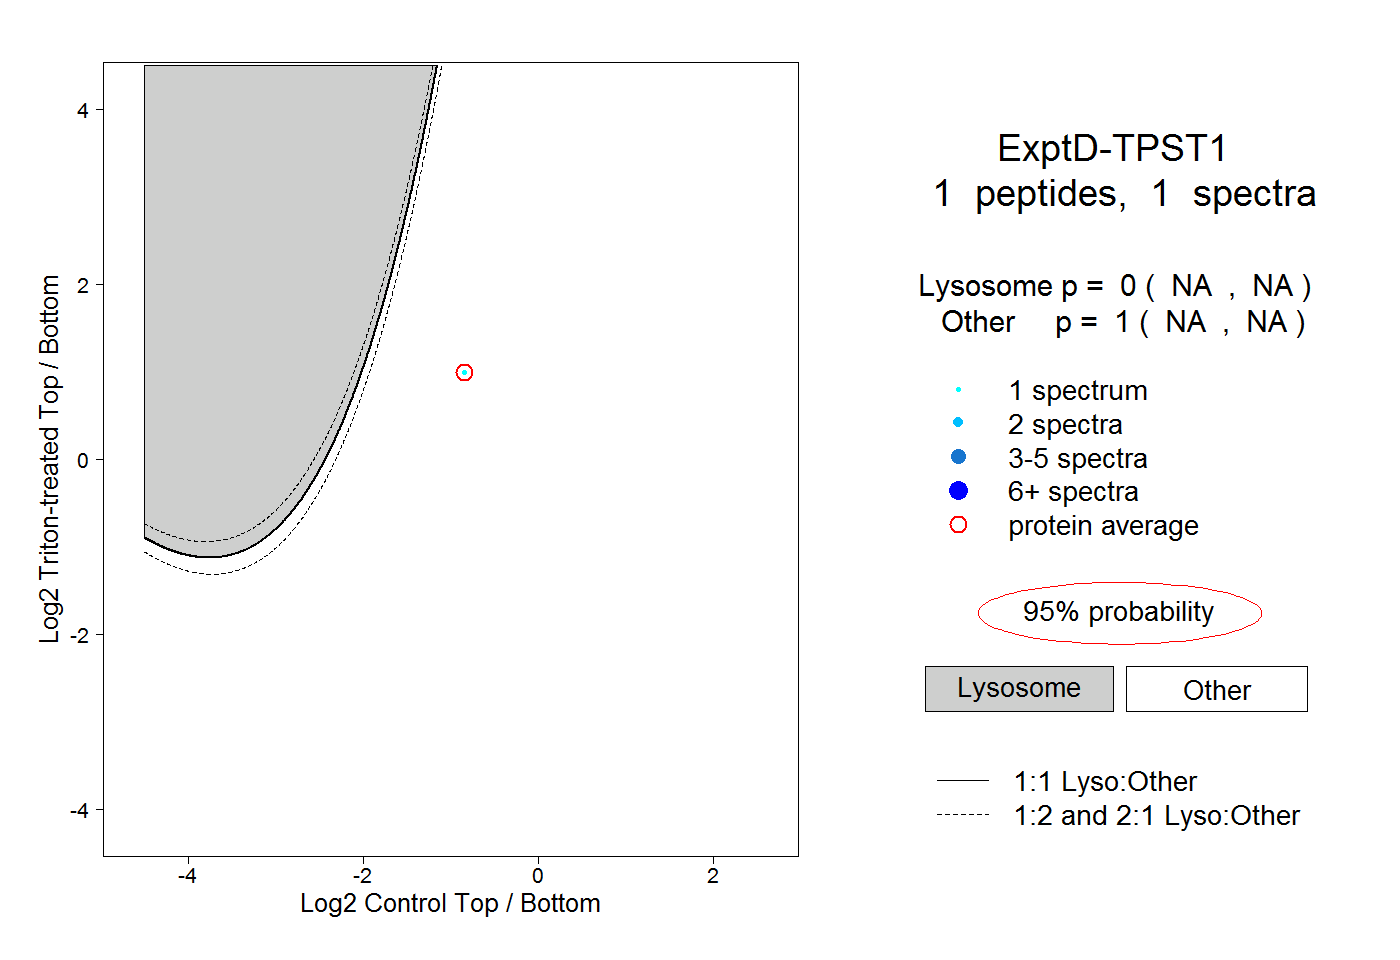
12peptides
spectra
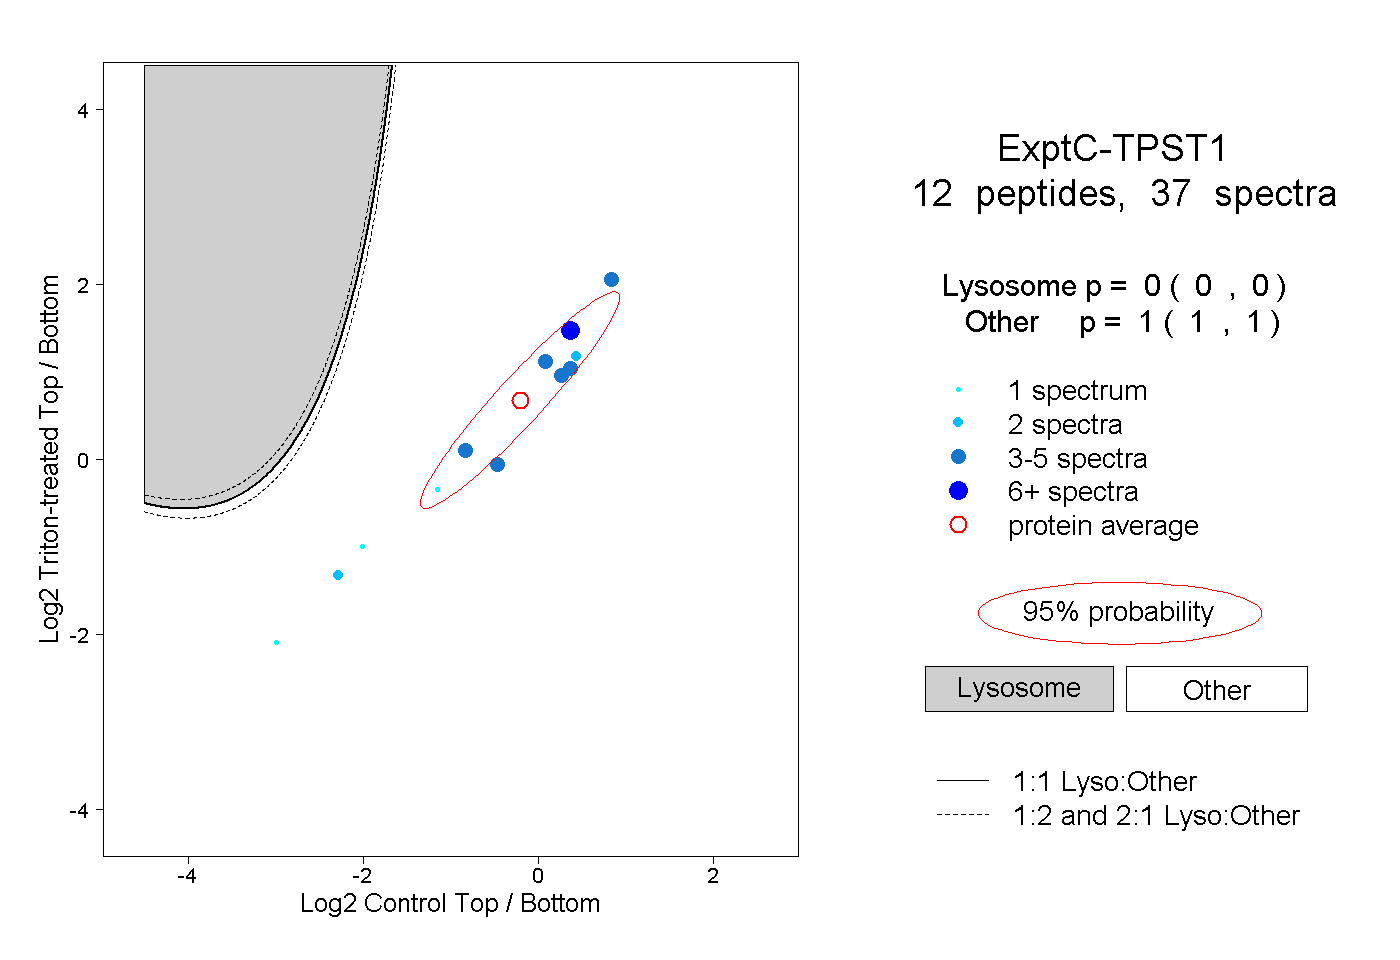
0.000 | 0.000
1.000 | 1.000