TPST1
[ENSRNOP00000060104]
Main page
| | | Plot |
Mito |
Lyso |
|
Perox |
ER |
Golgi |
PM |
Cytosol |
Nucleus |
|
| Expt A |
 10
10
peptides |
15
spectra |
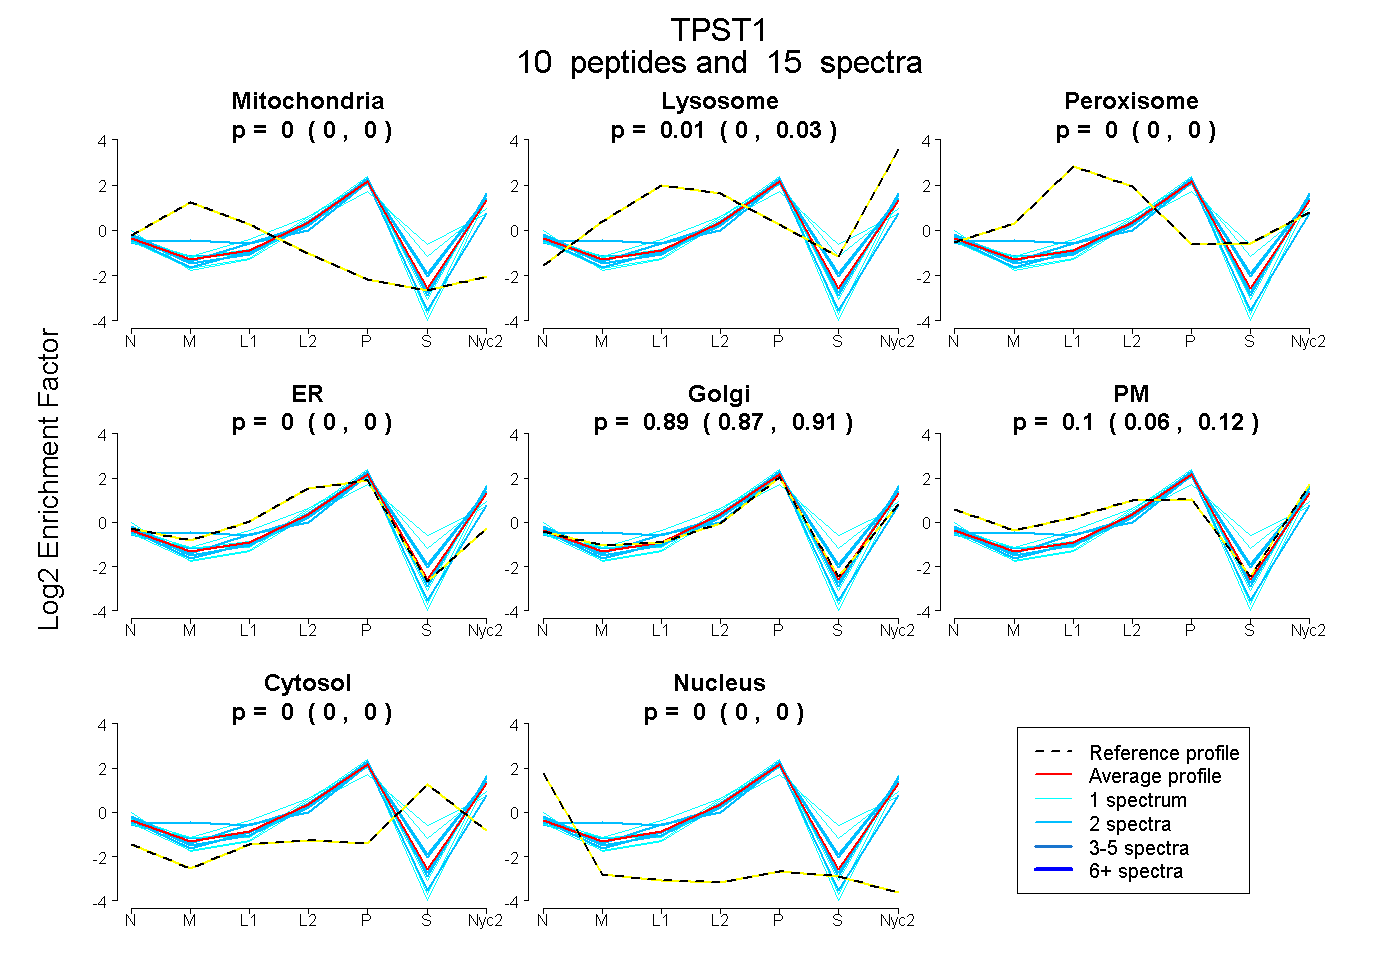 |
0.000
0.000 | 0.000 |
0.012
0.000 | 0.029 |
|
0.000
0.000 | 0.000 |
0.000
0.000 | 0.000 |
0.890
0.871 | 0.907 |
0.097
0.063 | 0.122 |
0.000
0.000 | 0.000 |
0.000
0.000 | 0.000 |
|
| | | Plot |
Mito |
|
Lyso or Perox |
|
ER |
Golgi |
PM |
Cytosol |
Nucleus |
|
| Expt B |
4
peptides |
5
spectra |
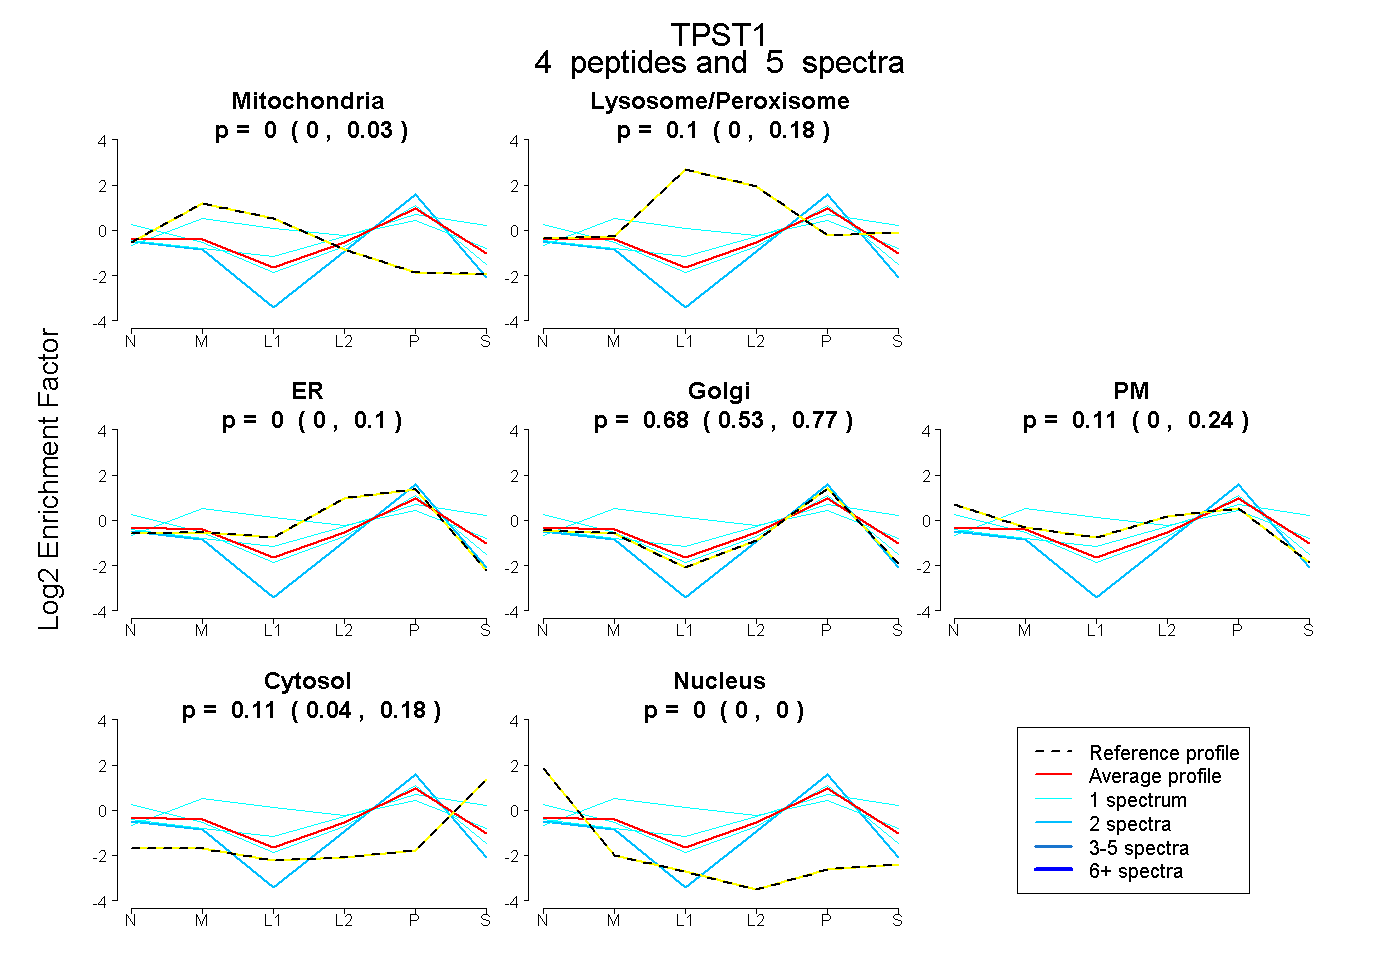 |
0.000
0.000 | 0.030 |
|
0.096
0.000 | 0.185 |
|
0.000
0.000 | 0.098 |
0.682
0.532 | 0.770 |
0.108
0.000 | 0.241 |
0.115
0.038 | 0.179 |
0.000
0.000 | 0.000 |
|
| 2 spectra, GEFQLPDFLK |
0.000 |
|
0.000 |
|
0.000 |
0.983 |
0.000 |
0.000 |
0.017 |
|
| 1 spectrum, SLTYLAR |
0.000 |
|
0.000 |
|
0.000 |
0.633 |
0.304 |
0.036 |
0.027 |
|
| 1 spectrum, LFPNAK |
0.227 |
|
0.323 |
|
0.000 |
0.418 |
0.000 |
0.032 |
0.000 |
|
| 1 spectrum, TFTYHK |
0.000 |
|
0.252 |
|
0.000 |
0.473 |
0.000 |
0.275 |
0.000 |
|
| | | Plot |
|
Lyso |
|
|
|
|
|
|
|
Other |
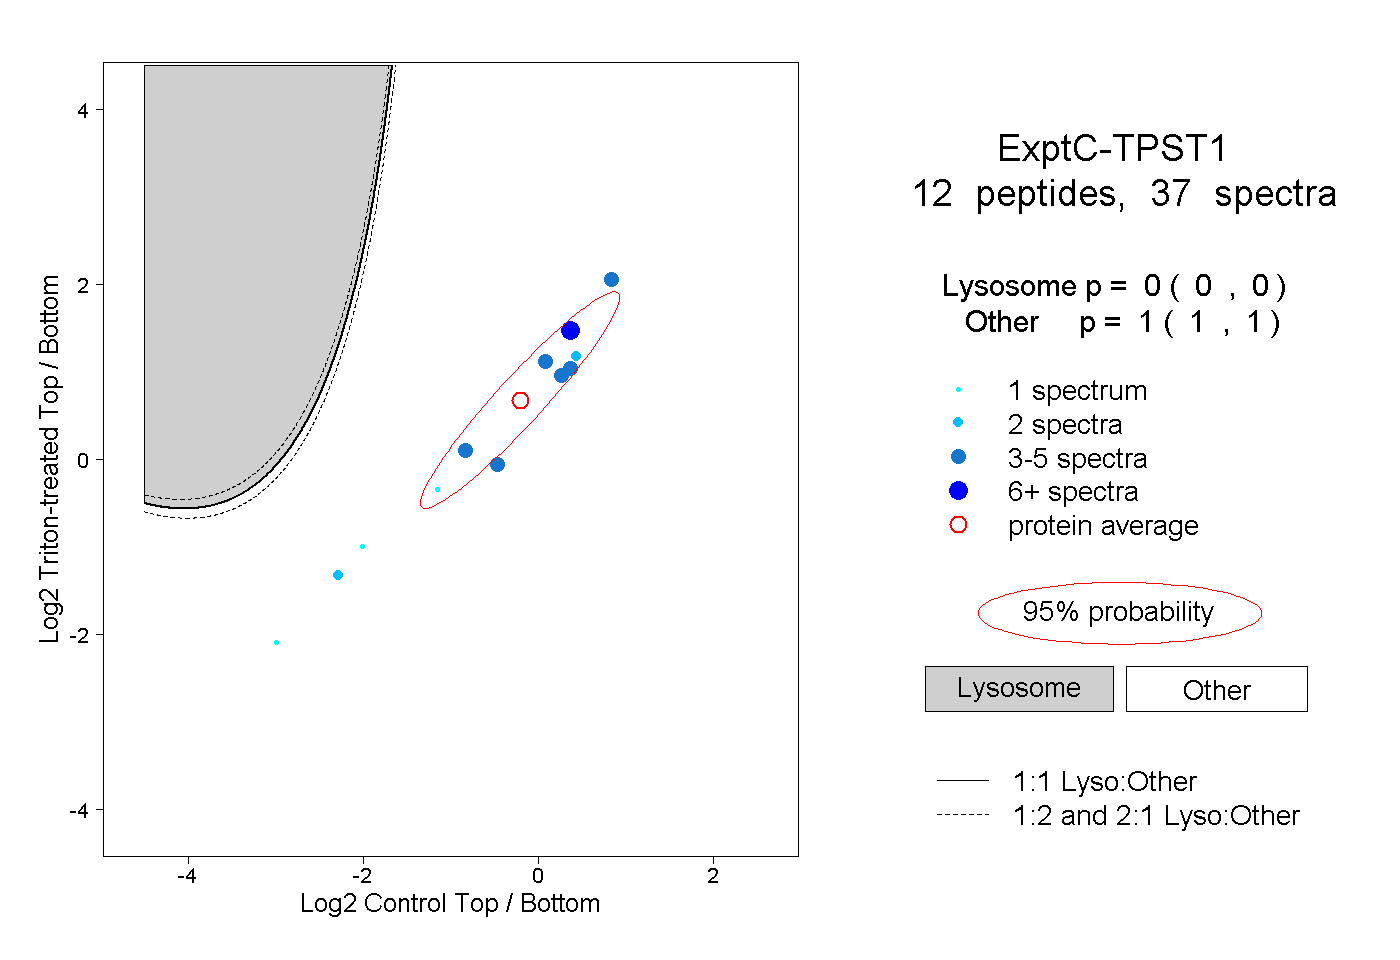
| Expt C |
12
peptides |
37
spectra |
 |
|
0.000
0.000 | 0.000 |
|
|
|
|
|
|
|
1.000
1.000 | 1.000 |
| | | Plot |
|
Lyso |
|
|
|
|
|
|
|
Other |
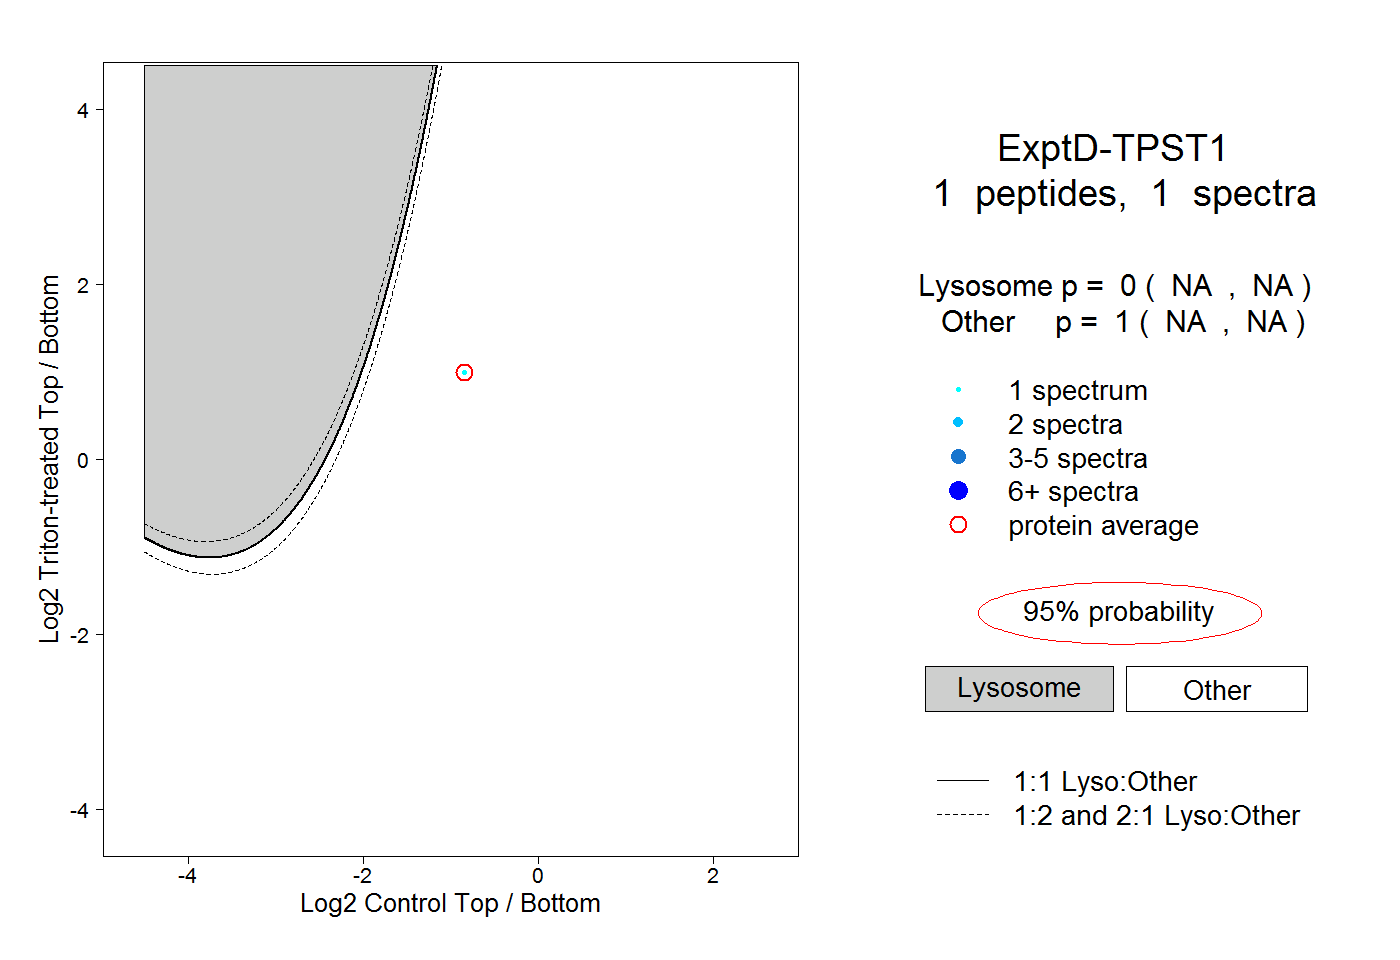
| Expt D |
1
peptide |
1
spectrum |
 |
|
0.000
NA | NA |
|
|
|
|
|
|
|
1.000
NA | NA |