 10
10peptides
spectra
0.000 | 0.000
0.000 | 0.029
0.000 | 0.000
0.000 | 0.000
0.871 | 0.907
0.063 | 0.122
0.000 | 0.000
0.000 | 0.000
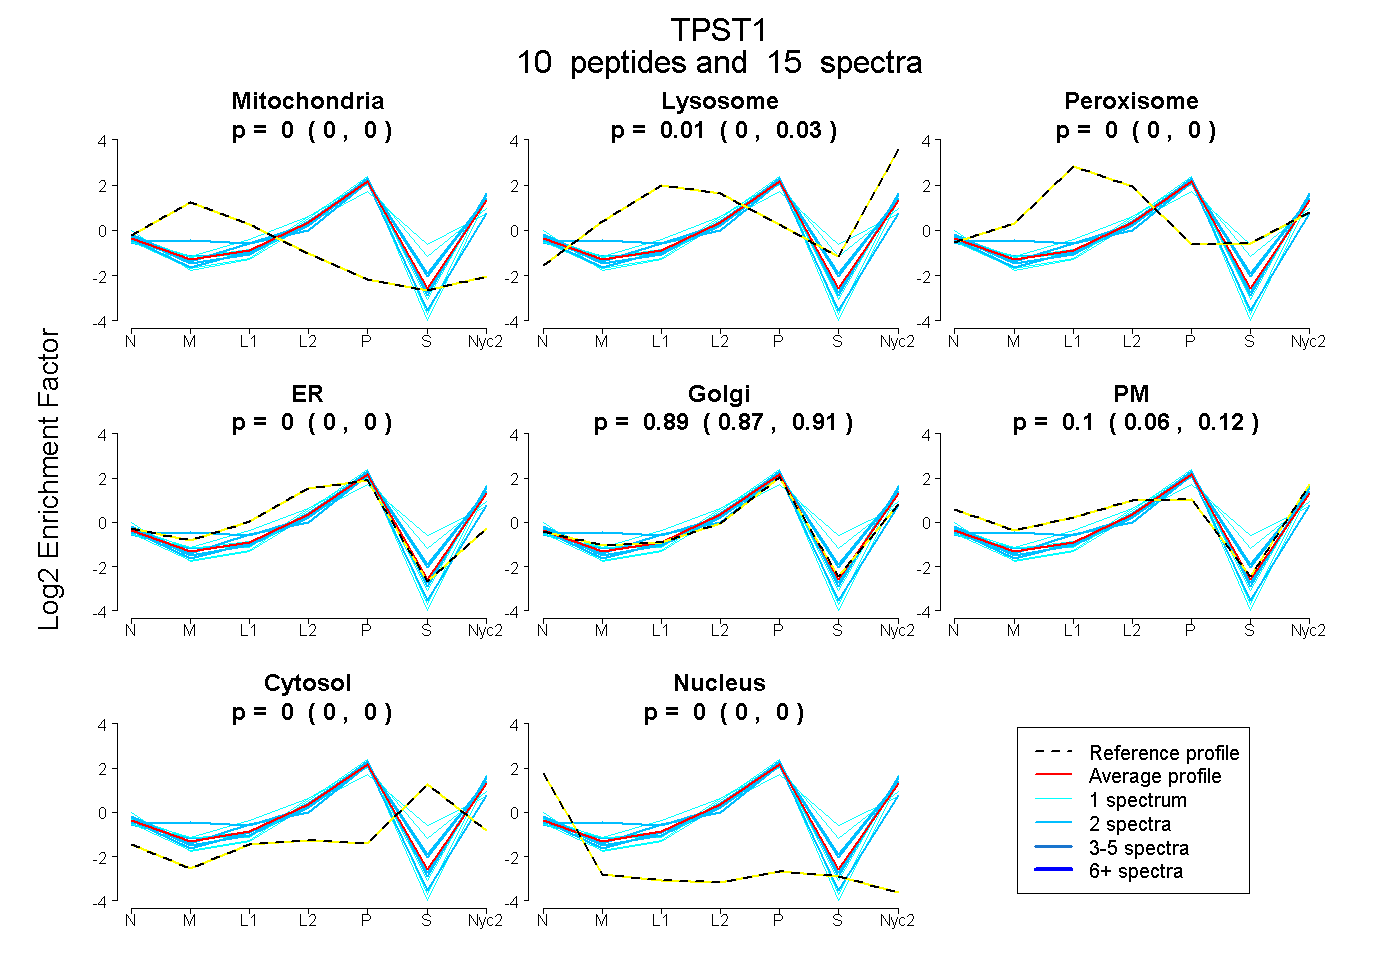
| Plot | Mito | Lyso | Perox | ER | Golgi | PM | Cytosol | Nucleus | |||||
| Expt A |
10 peptides |
15 spectra |
|
0.000 0.000 | 0.000 |
0.012 0.000 | 0.029 |
0.000 0.000 | 0.000 |
0.000 0.000 | 0.000 |
0.890 0.871 | 0.907 |
0.097 0.063 | 0.122 |
0.000 0.000 | 0.000 |
0.000 0.000 | 0.000 |
| 1 spectrum, ILENTR | 0.000 | 0.000 | 0.000 | 0.000 | 0.816 | 0.184 | 0.000 | 0.000 | ||
| 1 spectrum, AMLDAHPDIR | 0.000 | 0.000 | 0.000 | 0.000 | 0.633 | 0.106 | 0.261 | 0.000 | ||
| 2 spectra, SLTYLAR | 0.000 | 0.004 | 0.000 | 0.000 | 0.921 | 0.075 | 0.000 | 0.000 | ||
| 1 spectrum, AGGVSLSK | 0.000 | 0.000 | 0.000 | 0.009 | 0.832 | 0.159 | 0.000 | 0.000 | ||
| 2 spectra, SGTTLMR | 0.015 | 0.000 | 0.000 | 0.211 | 0.714 | 0.060 | 0.000 | 0.000 | ||
| 1 spectrum, EKPQTEQVE | 0.000 | 0.150 | 0.000 | 0.184 | 0.553 | 0.000 | 0.113 | 0.000 | ||
| 1 spectrum, NMPLIFIGGVPR | 0.000 | 0.000 | 0.000 | 0.000 | 0.978 | 0.022 | 0.000 | 0.000 | ||
| 2 spectra, LFPNAK | 0.000 | 0.000 | 0.000 | 0.000 | 0.888 | 0.112 | 0.000 | 0.000 | ||
| 2 spectra, TFTYHK | 0.000 | 0.068 | 0.000 | 0.000 | 0.887 | 0.039 | 0.007 | 0.000 | ||
| 2 spectra, DPFALK | 0.000 | 0.077 | 0.000 | 0.000 | 0.910 | 0.000 | 0.013 | 0.000 |
| Plot | Mito | Lyso or Perox | ER | Golgi | PM | Cytosol | Nucleus | ||||||
| Expt B |
4 peptides |
5 spectra |
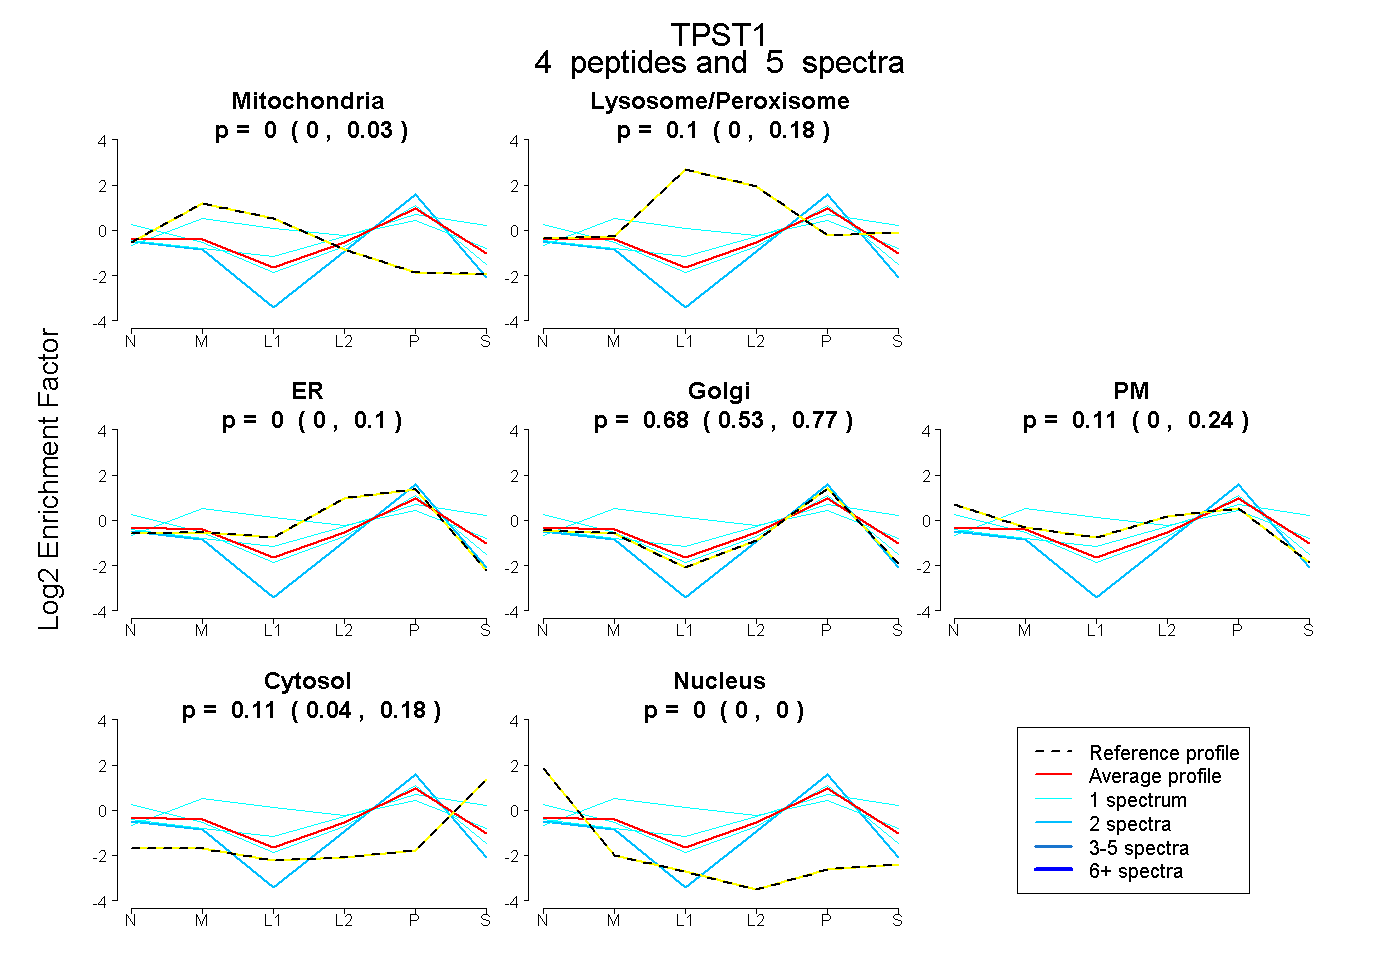 |
0.000 0.000 | 0.030 |
0.096 0.000 | 0.185 |
0.000 0.000 | 0.098 |
0.682 0.532 | 0.770 |
0.108 0.000 | 0.241 |
0.115 0.038 | 0.179 |
0.000 0.000 | 0.000 |
|||
| Plot | Lyso | Other | |||||||||||
| Expt C |
12 peptides |
37 spectra |
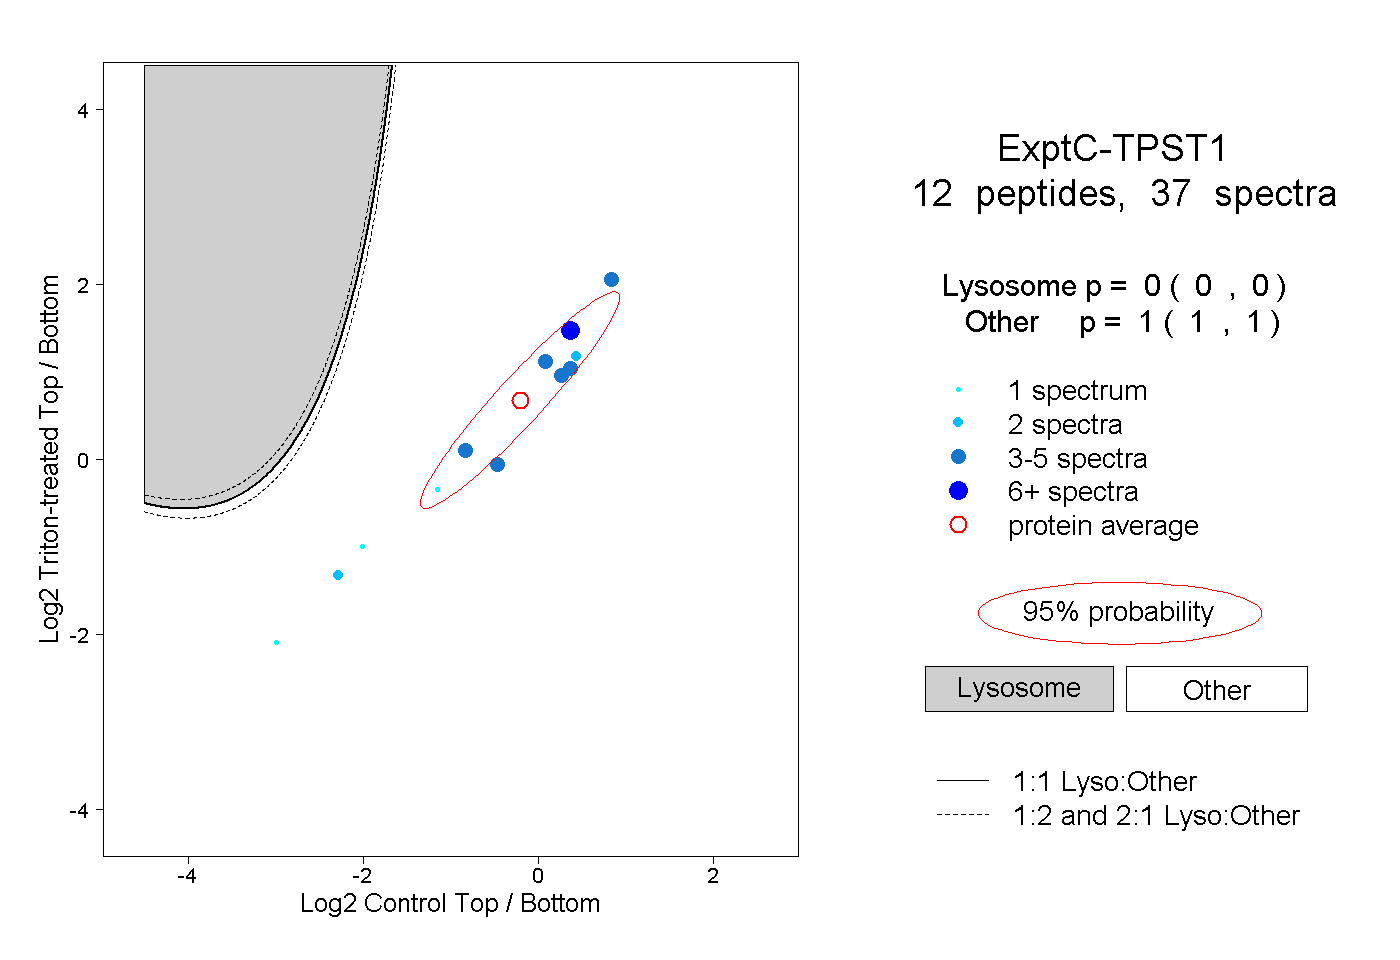 |
0.000 0.000 | 0.000 |
1.000 1.000 | 1.000 |
||||||||
| Plot | Lyso | Other | |||||||||||
| Expt D |
1 peptide |
1 spectrum |
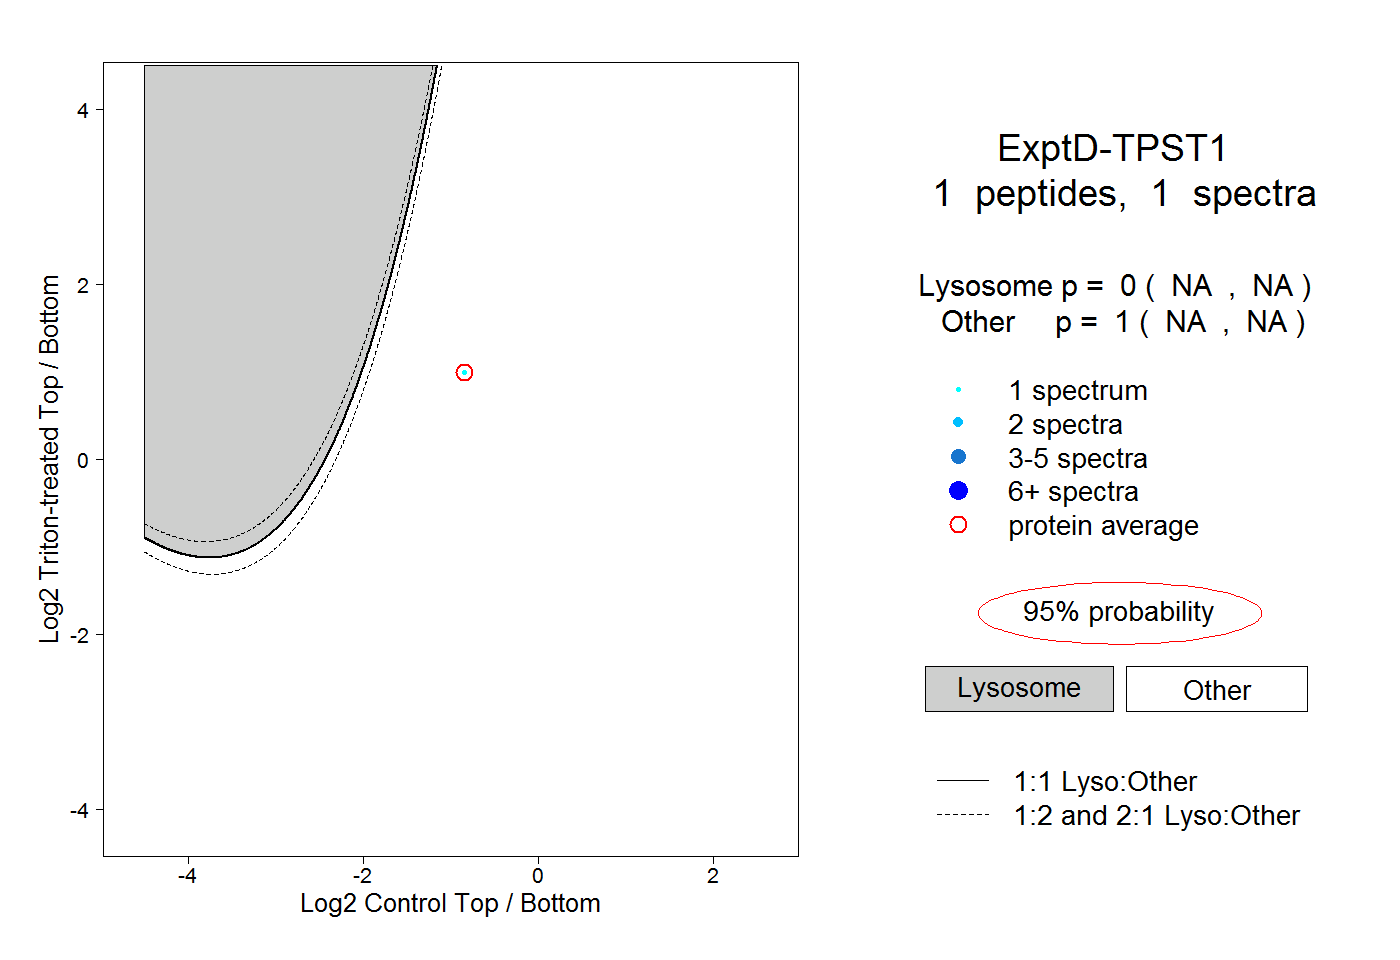 |
0.000 NA | NA |
1.000 NA | NA |