 18
18peptides
spectra
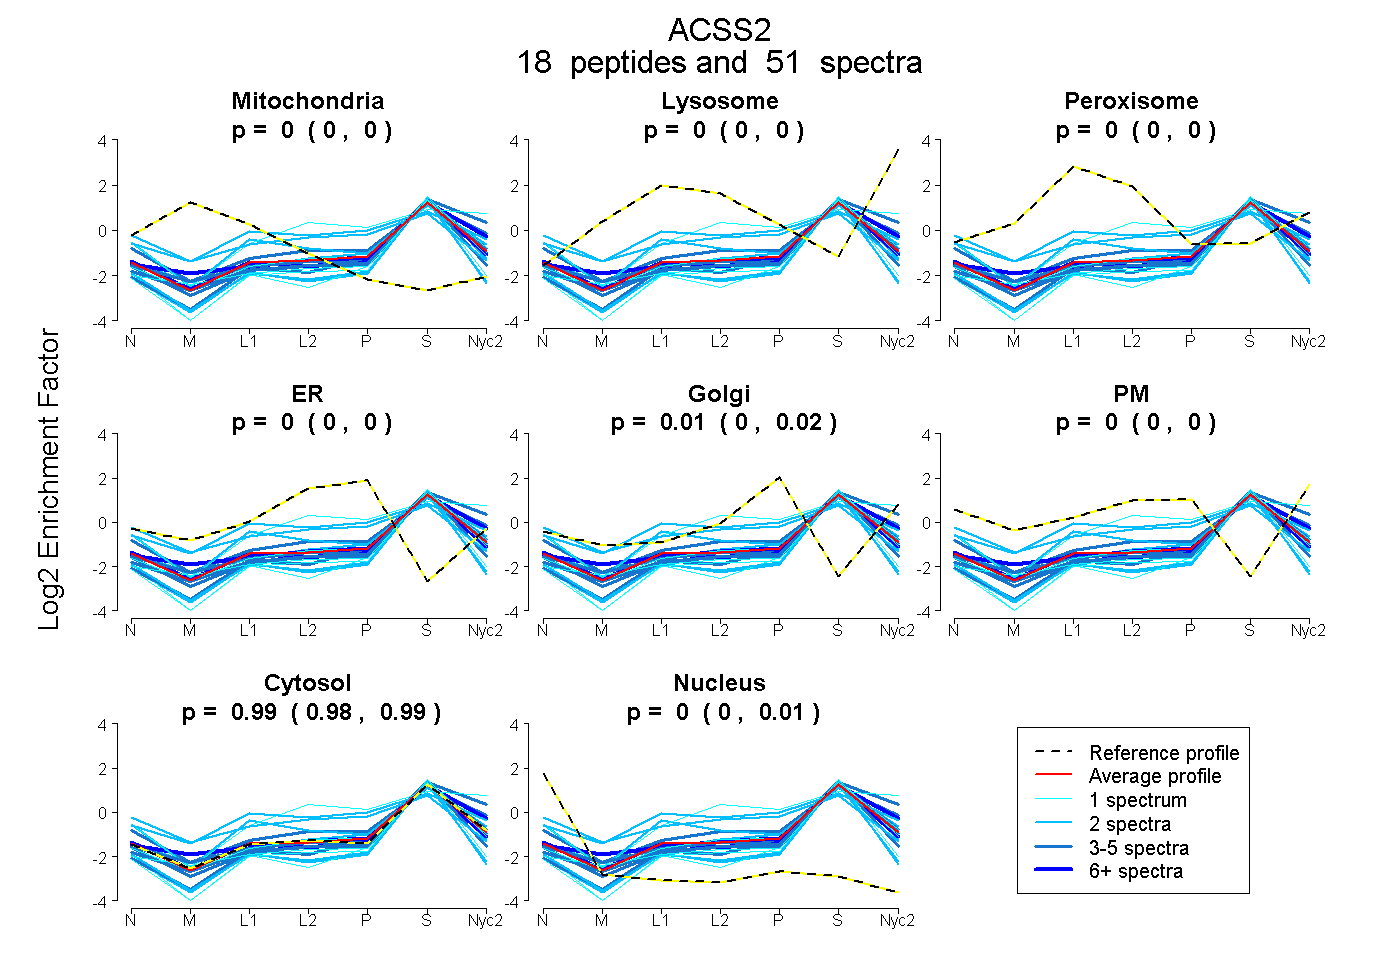
0.000 | 0.000
0.000 | 0.000
0.000 | 0.000
0.000 | 0.004
0.004 | 0.018
0.000 | 0.000
0.980 | 0.989
0.000 | 0.007
5peptides
spectra
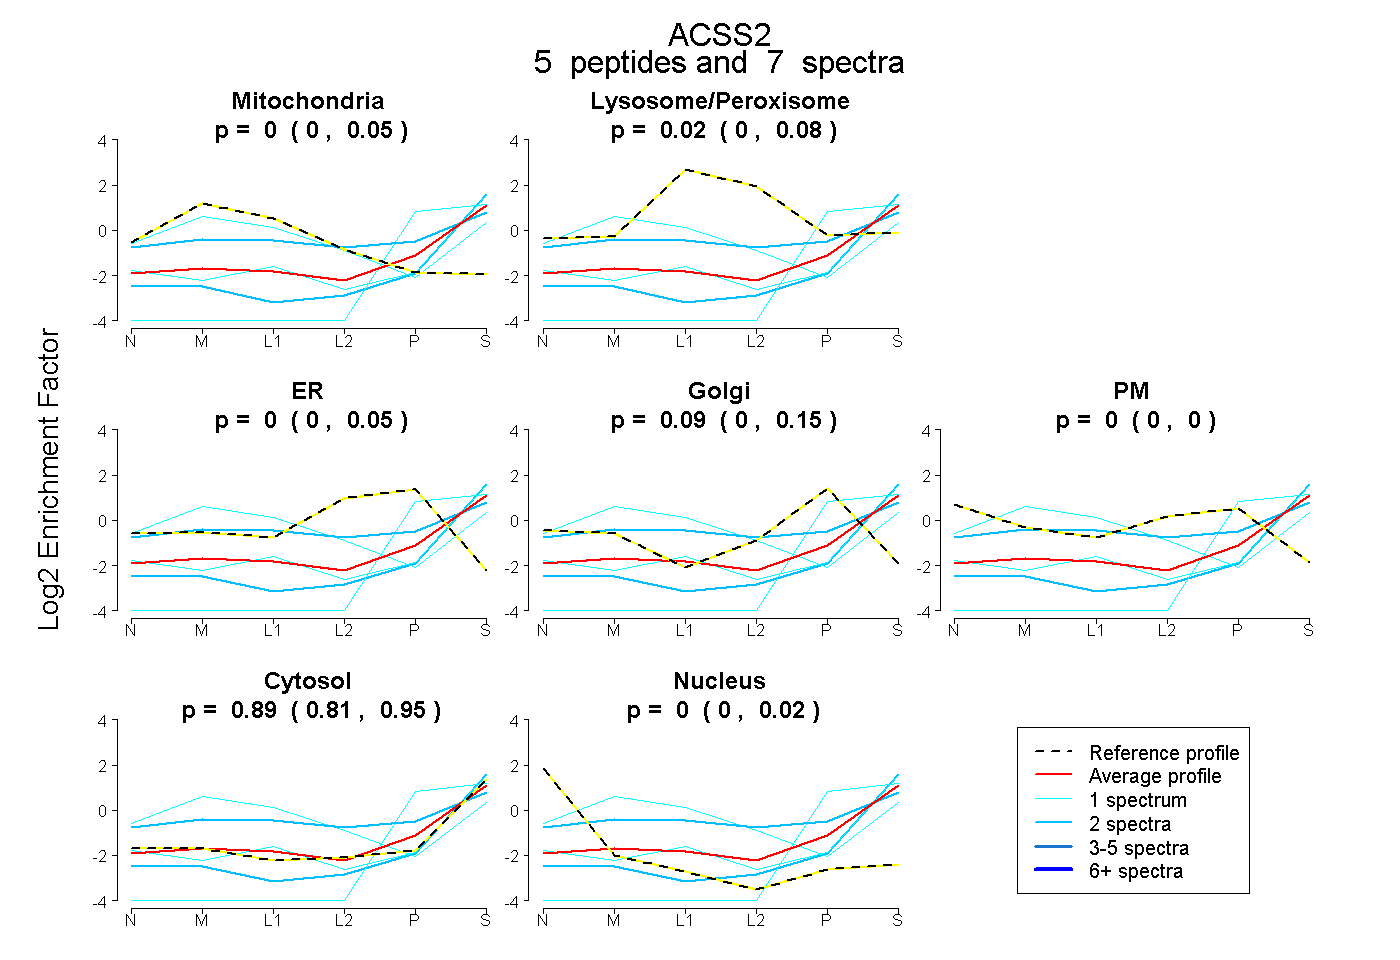
0.000 | 0.050
0.000 | 0.083
0.000 | 0.051
0.000 | 0.146
0.000 | 0.000
0.811 | 0.946
0.000 | 0.016
16peptides
spectra
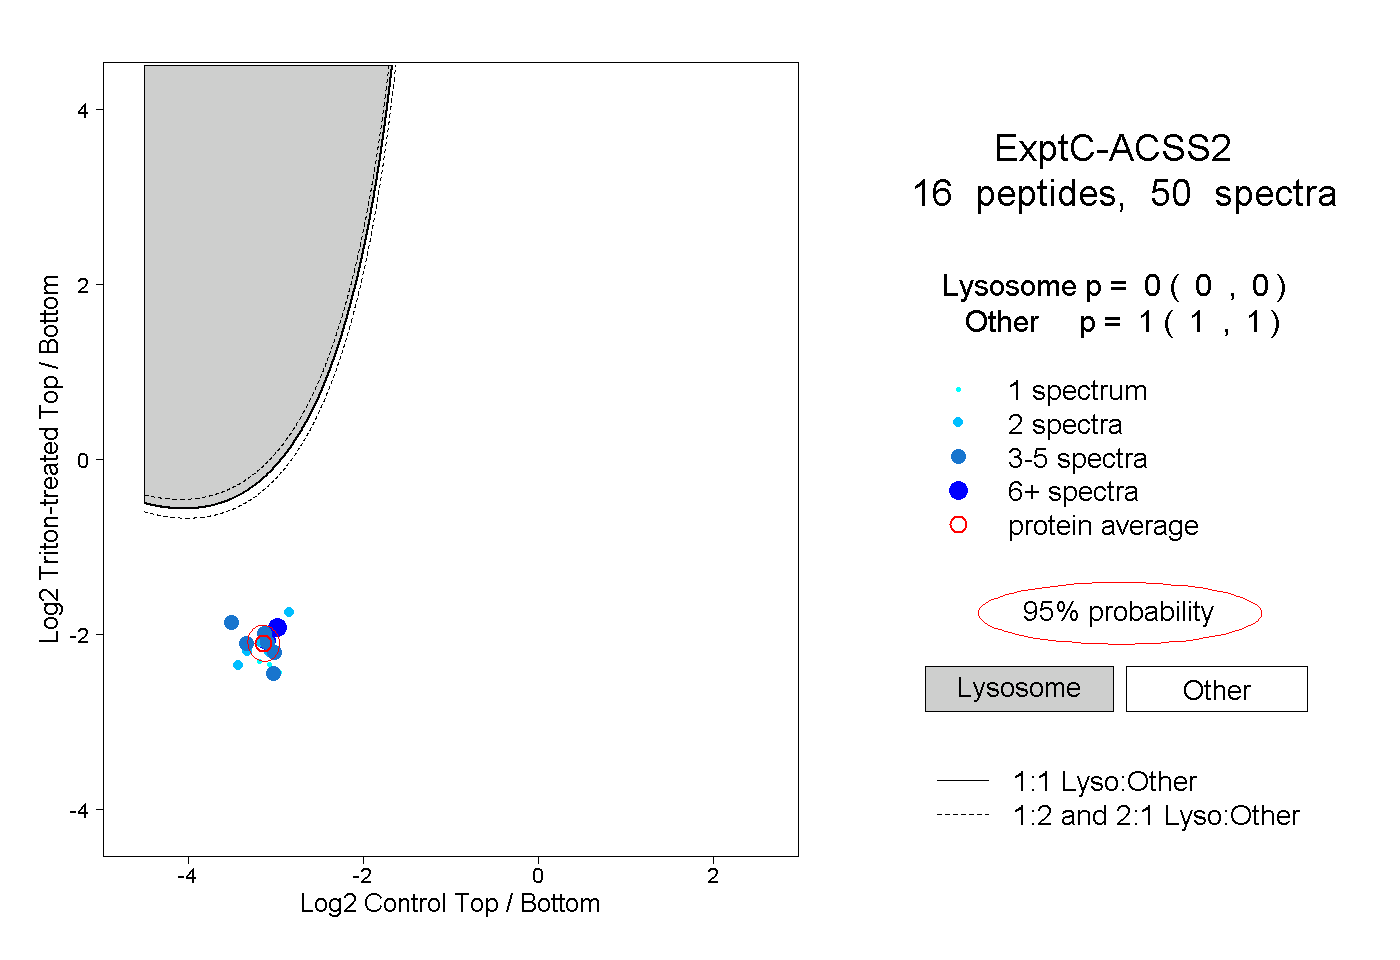
0.000 | 0.000
1.000 | 1.000
1peptide
spectrum
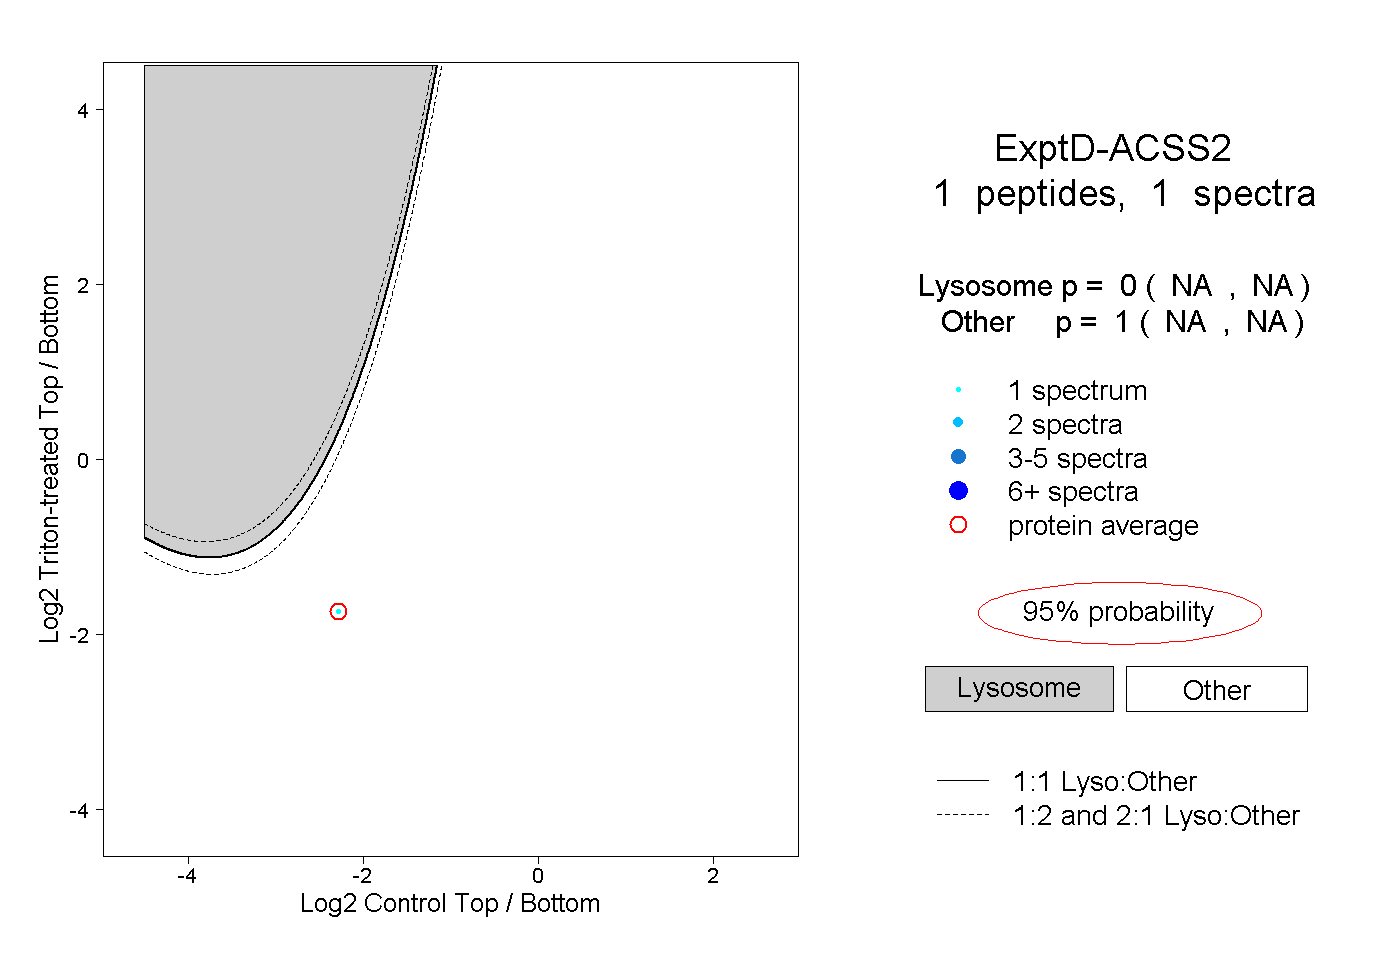
NA | NA
NA | NA