40
40peptides
spectra
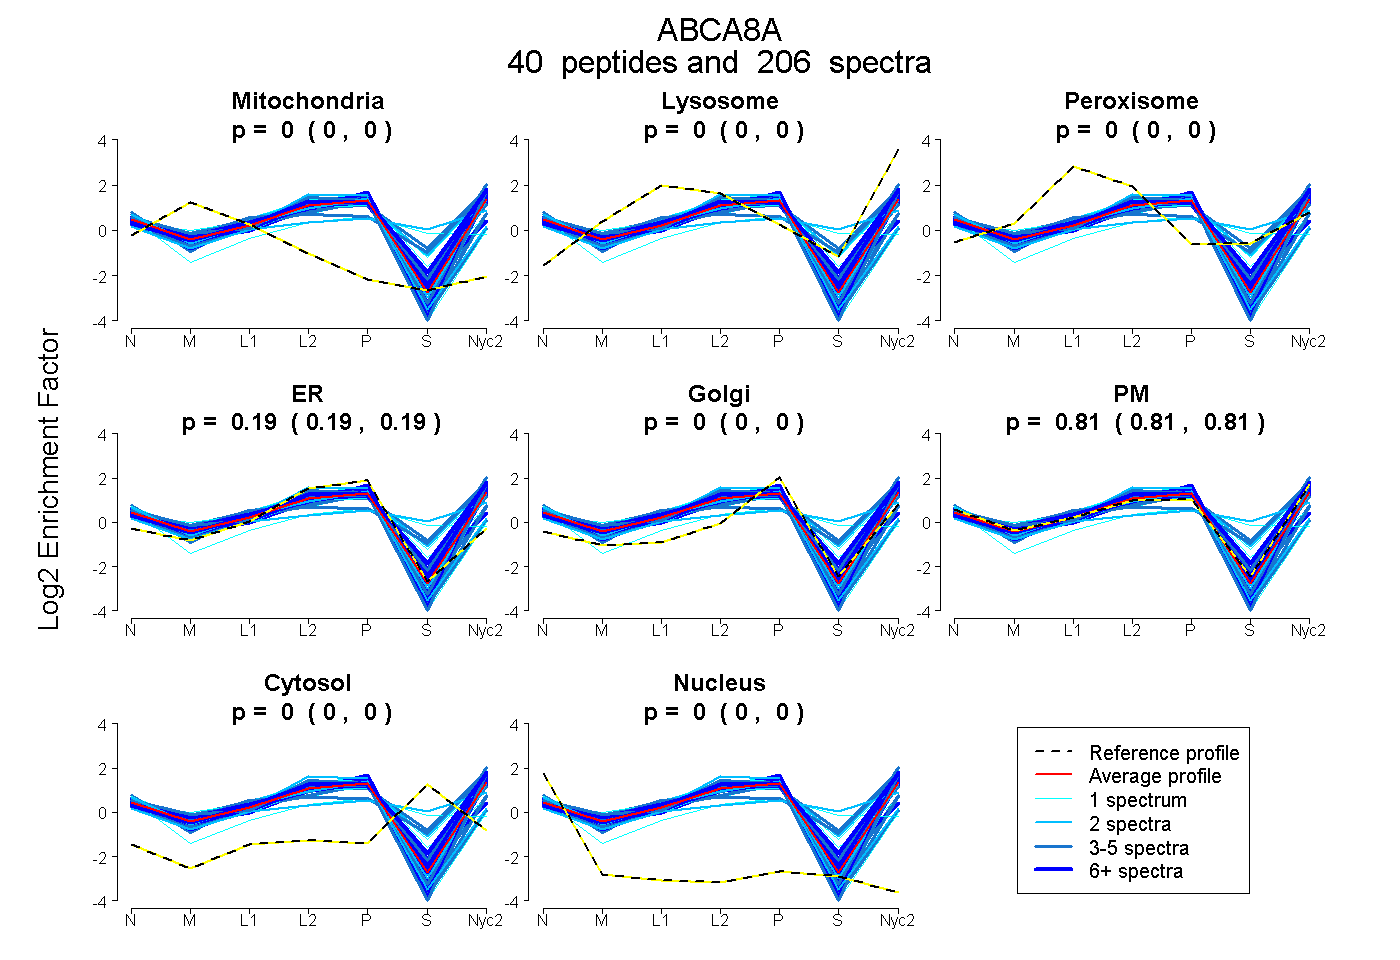
0.000 | 0.000
0.000 | 0.000
0.000 | 0.000
0.187 | 0.194
0.000 | 0.000
0.805 | 0.813
0.000 | 0.000
0.000 | 0.000
18peptides
spectra
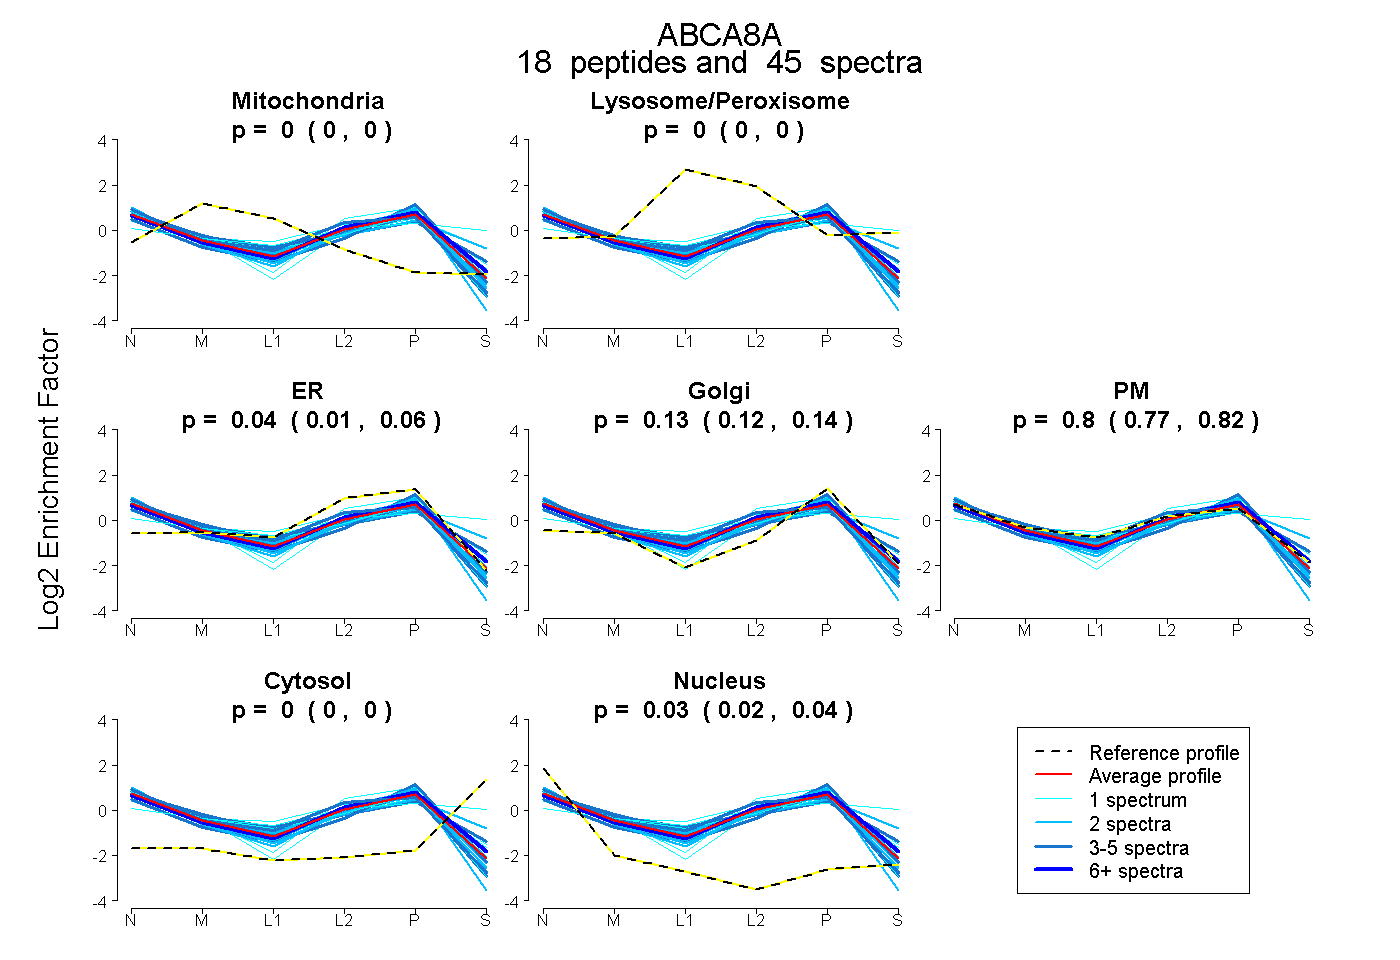
0.000 | 0.000
0.000 | 0.000
0.011 | 0.061
0.118 | 0.145
0.774 | 0.819
0.000 | 0.000
0.023 | 0.037