MPO
[ENSRNOP00000059901]
Main page
| | | Plot |
Mito |
Lyso |
|
Perox |
ER |
Golgi |
PM |
Cytosol |
Nucleus |
|
| Expt A |
 14
14
peptides |
45
spectra |
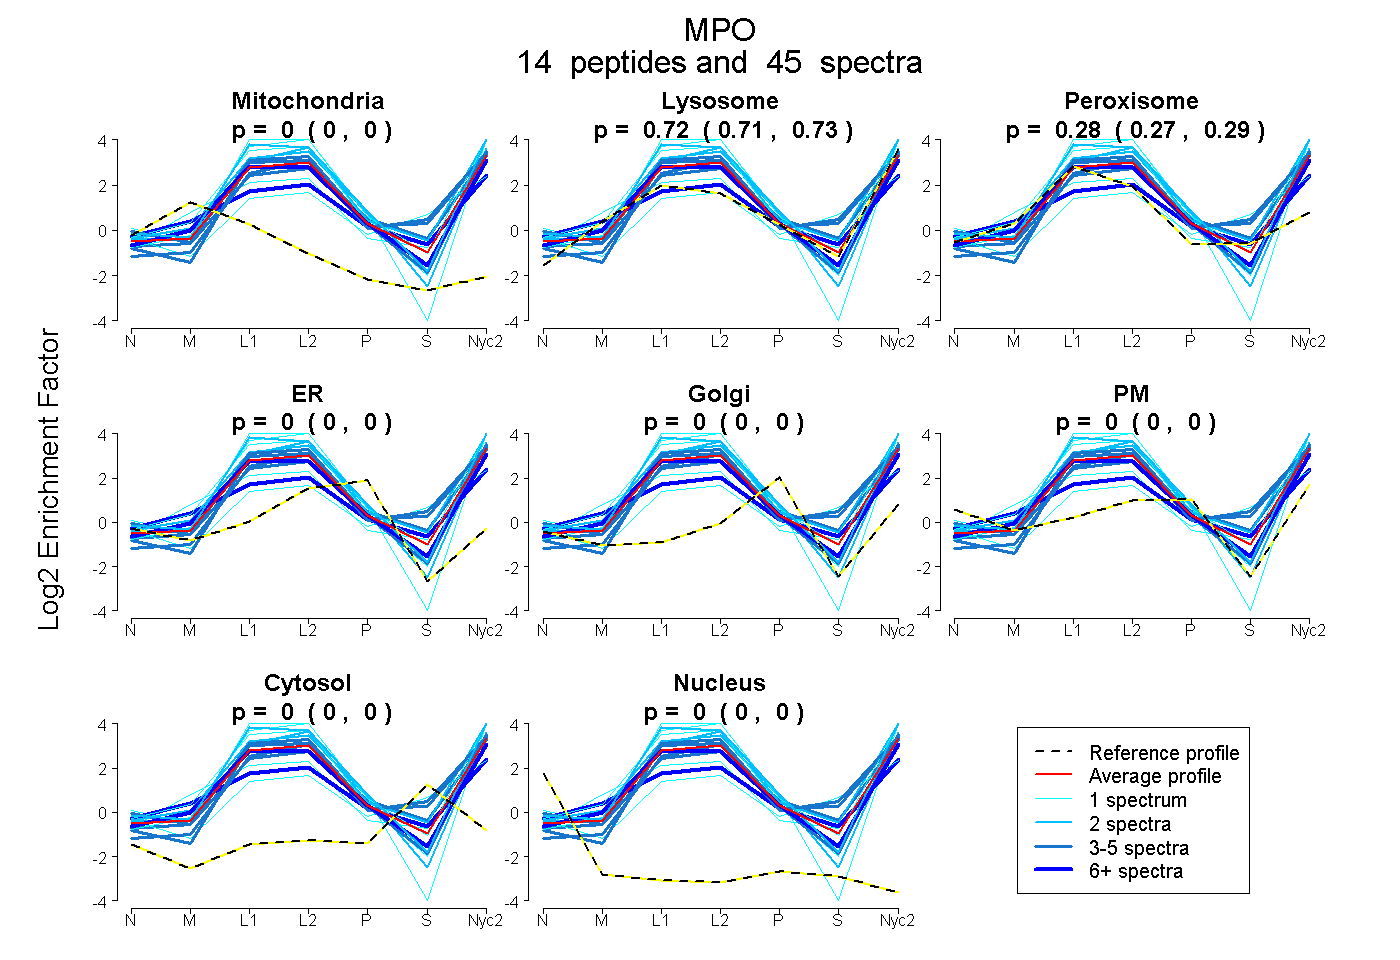 |
0.000
0.000 | 0.000 |
0.722
0.707 | 0.733 |
|
0.278
0.265 | 0.291 |
0.000
0.000 | 0.000 |
0.000
0.000 | 0.000 |
0.000
0.000 | 0.000 |
0.000
0.000 | 0.000 |
0.000
0.000 | 0.000 |
|
| | | Plot |
Mito |
|
Lyso or Perox |
|
ER |
Golgi |
PM |
Cytosol |
Nucleus |
|
| Expt B |
7
peptides |
10
spectra |
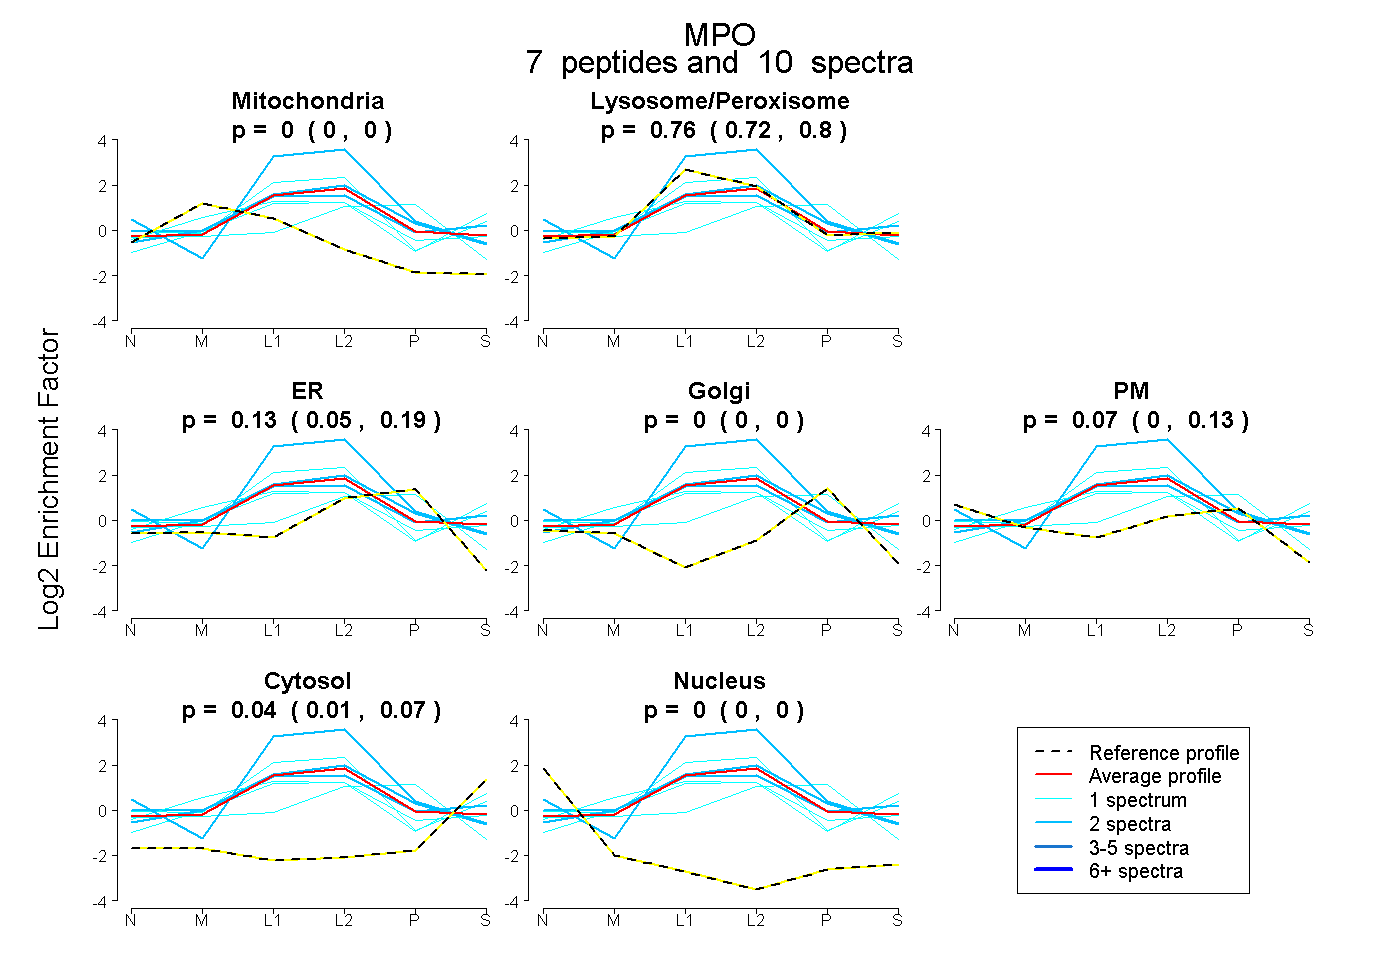 |
0.000
0.000 | 0.000 |
|
0.762
0.716 | 0.804 |
|
0.128
0.046 | 0.194 |
0.000
0.000 | 0.000 |
0.070
0.000 | 0.132 |
0.040
0.010 | 0.065 |
0.000
0.000 | 0.000 |
|
| | | Plot |
|
Lyso |
|
|
|
|
|
|
|
Other |
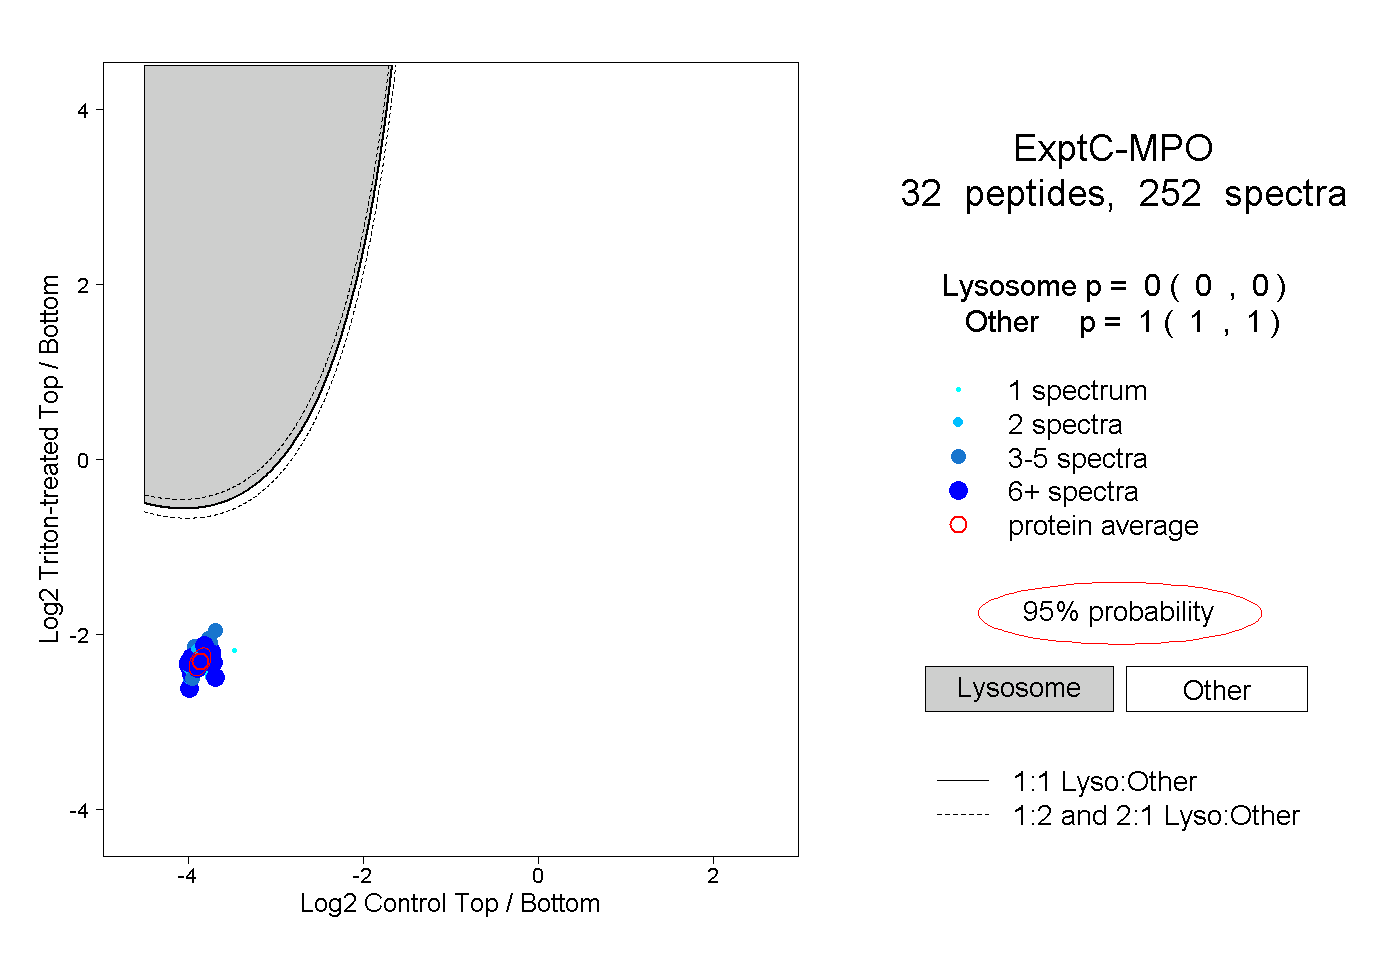
| Expt C |
32
peptides |
252
spectra |
 |
|
0.000
0.000 | 0.000 |
|
|
|
|
|
|
|
1.000
1.000 | 1.000 |
| | | Plot |
|
Lyso |
|
|
|
|
|
|
|
Other |
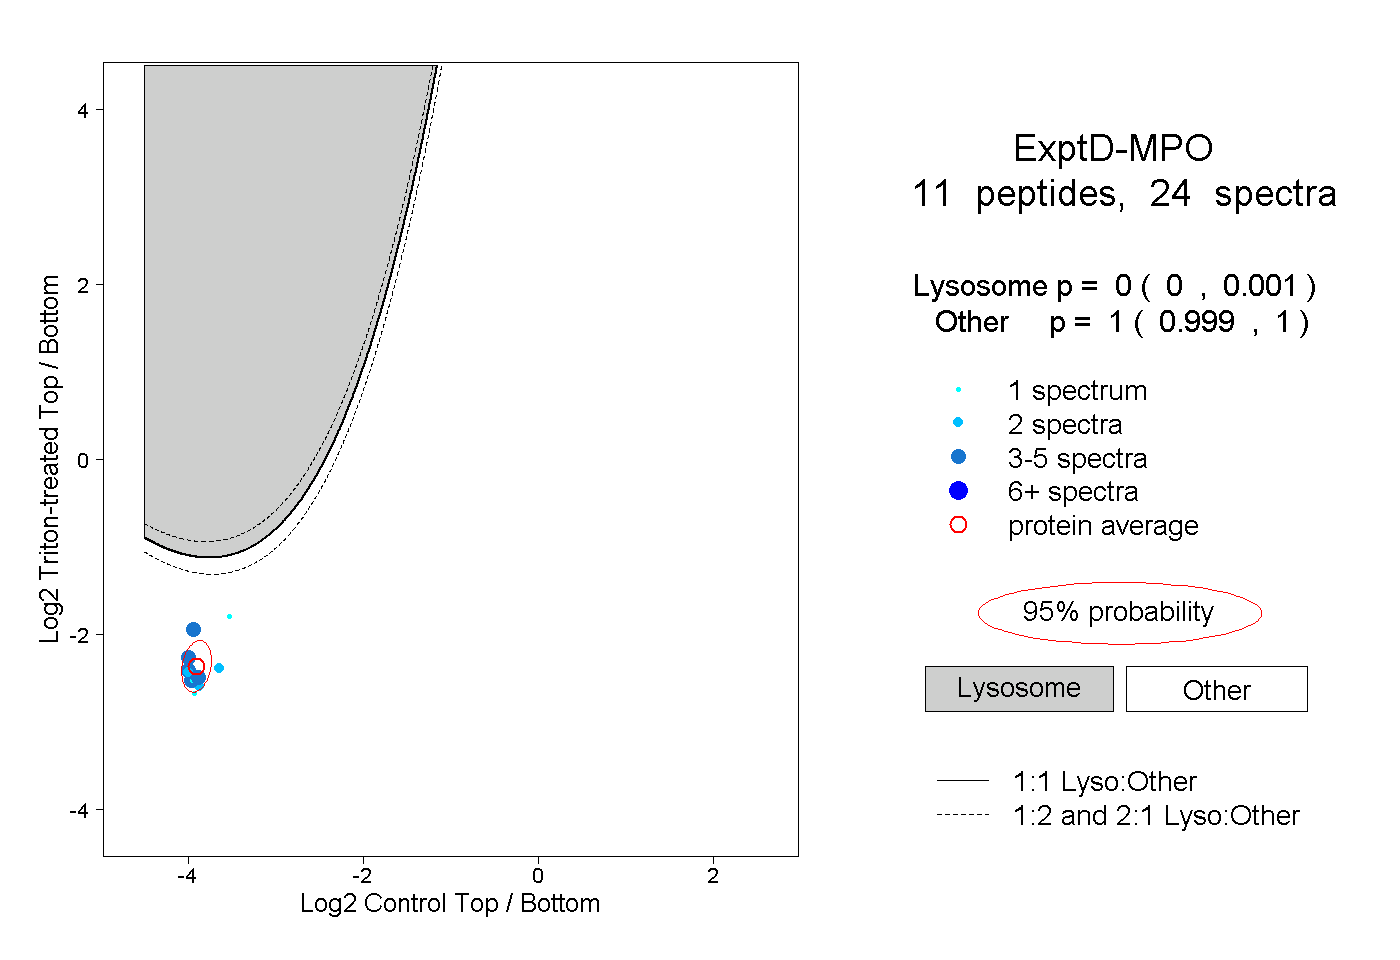
| Expt D |
11
peptides |
24
spectra |
 |
|
0.000
0.000 | 0.001 |
|
|
|
|
|
|
|
1.000
0.999 | 1.000 |
| 2 spectra, VVLEGGIDPILR |
|
0.000 |
|
|
|
|
|
|
|
1.000 |
| 3 spectra, DCIPFFR |
|
0.000 |
|
|
|
|
|
|
|
1.000 |
| 1 spectrum, QVSNAIVR |
|
0.000 |
|
|
|
|
|
|
|
1.000 |
| 2 spectra, LFEQVMR |
|
0.000 |
|
|
|
|
|
|
|
1.000 |
| 1 spectrum, IPPNDPR |
|
0.000 |
|
|
|
|
|
|
|
1.000 |
| 3 spectra, QALATISLPR |
|
0.000 |
|
|
|
|
|
|
|
1.000 |
| 3 spectra, YLPQYR |
|
0.000 |
|
|
|
|
|
|
|
1.000 |
| 3 spectra, QNQIAVDEIR |
|
0.002 |
|
|
|
|
|
|
|
0.998 |
| 3 spectra, GLMATPAK |
|
0.000 |
|
|
|
|
|
|
|
1.000 |
| 2 spectra, FPNDQLTK |
|
0.000 |
|
|
|
|
|
|
|
1.000 |
| 1 spectrum, VTCPPQDK |
|
0.008 |
|
|
|
|
|
|
|
0.992 |