 2
2peptides
spectra
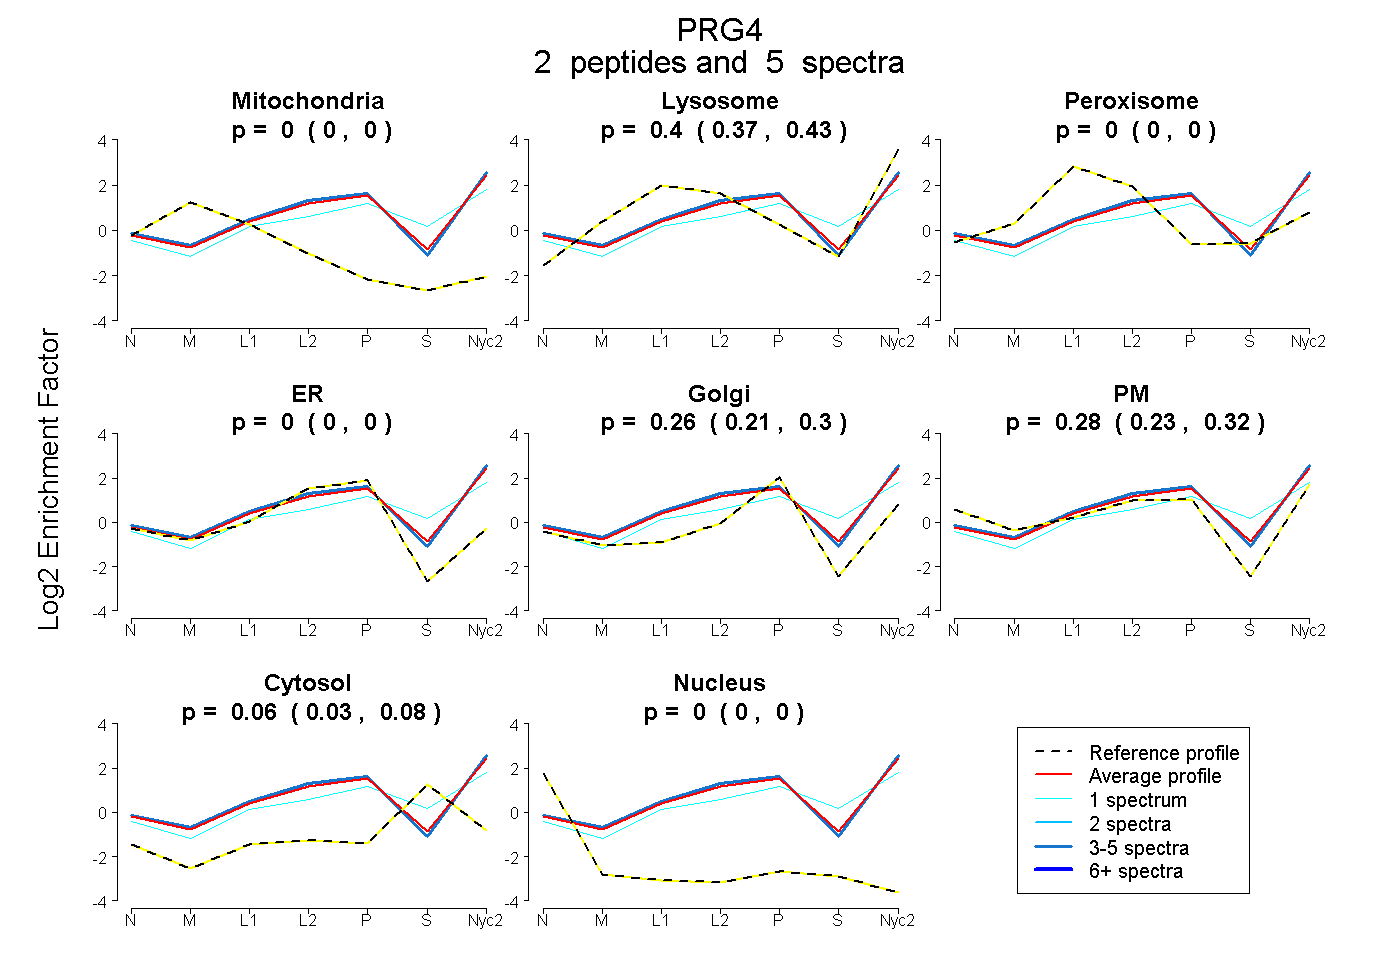
0.000 | 0.000
0.372 | 0.427
0.000 | 0.000
0.000 | 0.000
0.209 | 0.300
0.229 | 0.319
0.033 | 0.085
0.000 | 0.000
1peptide
spectra
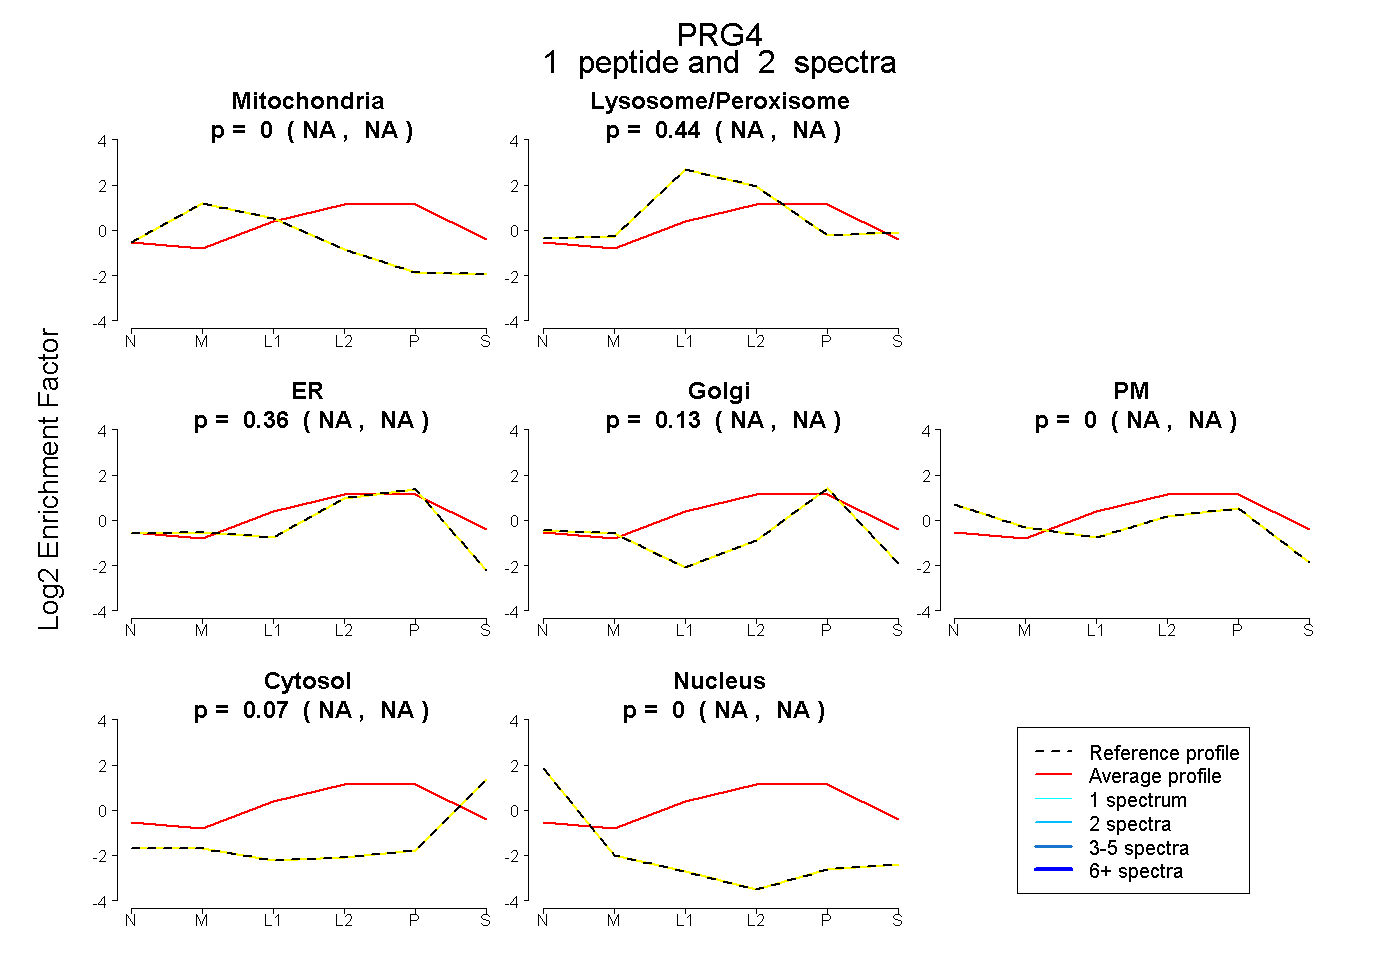
NA | NA
NA | NA
NA | NA
NA | NA
NA | NA
NA | NA
NA | NA
11peptides
spectra
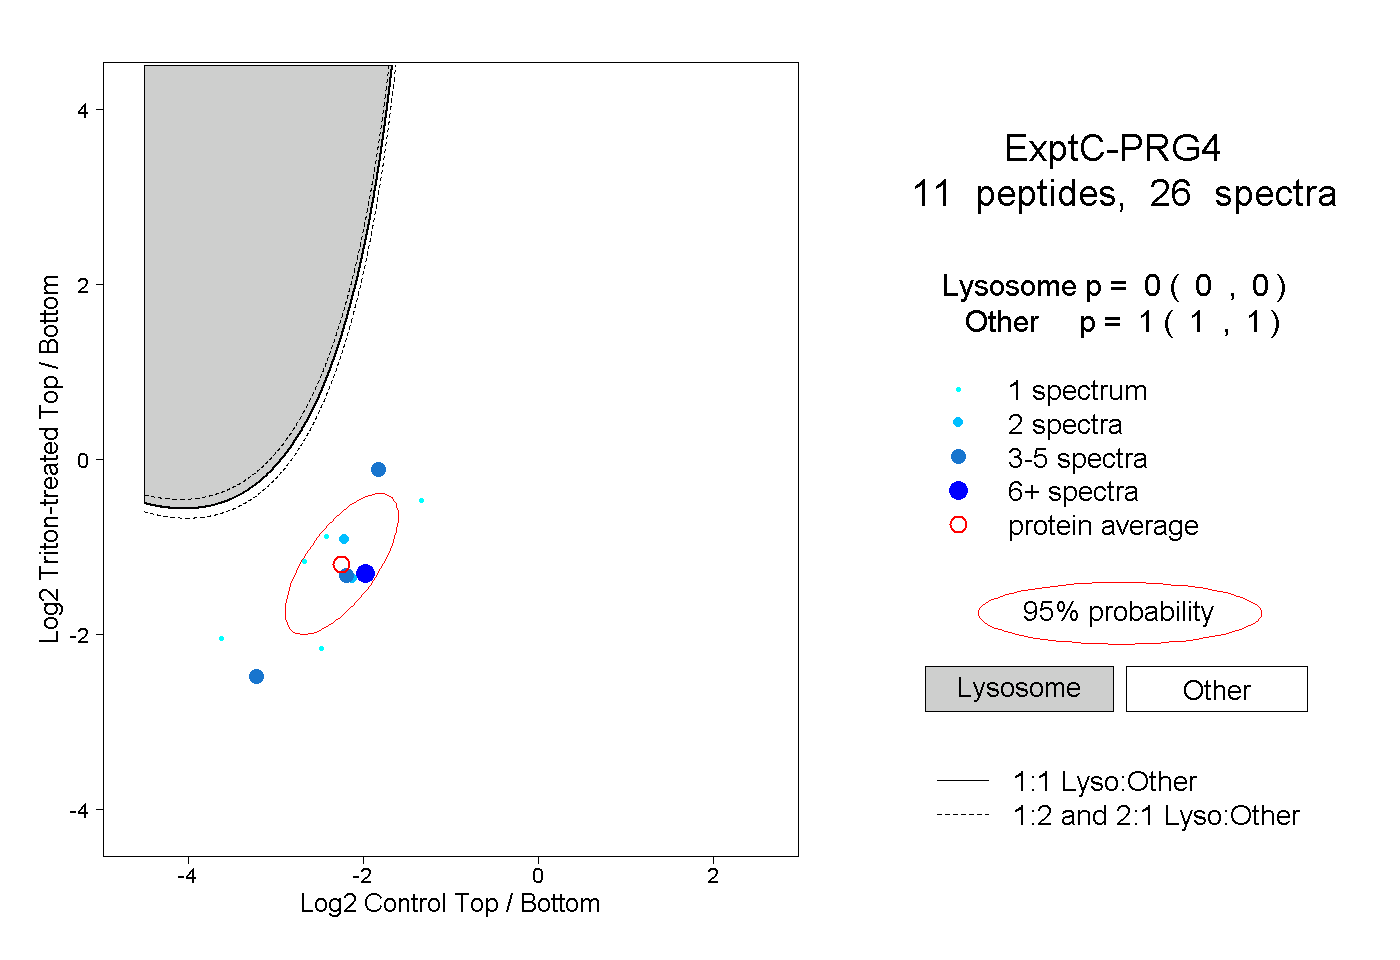
0.000 | 0.000
1.000 | 1.000
2peptides
spectra
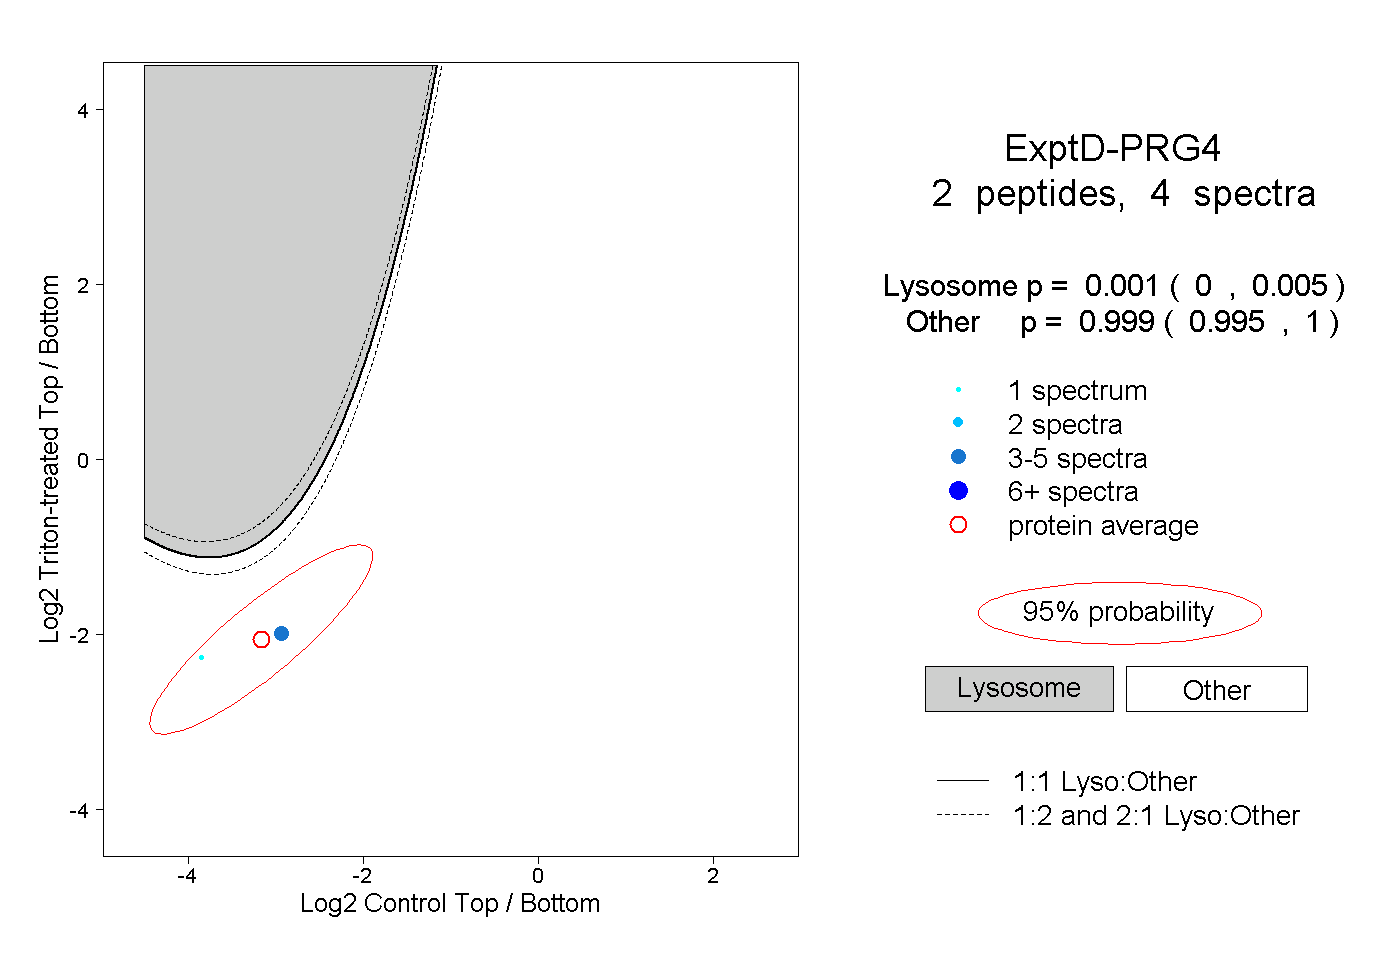
0.000 | 0.005
0.995 | 1.000