 4
4peptides
spectra
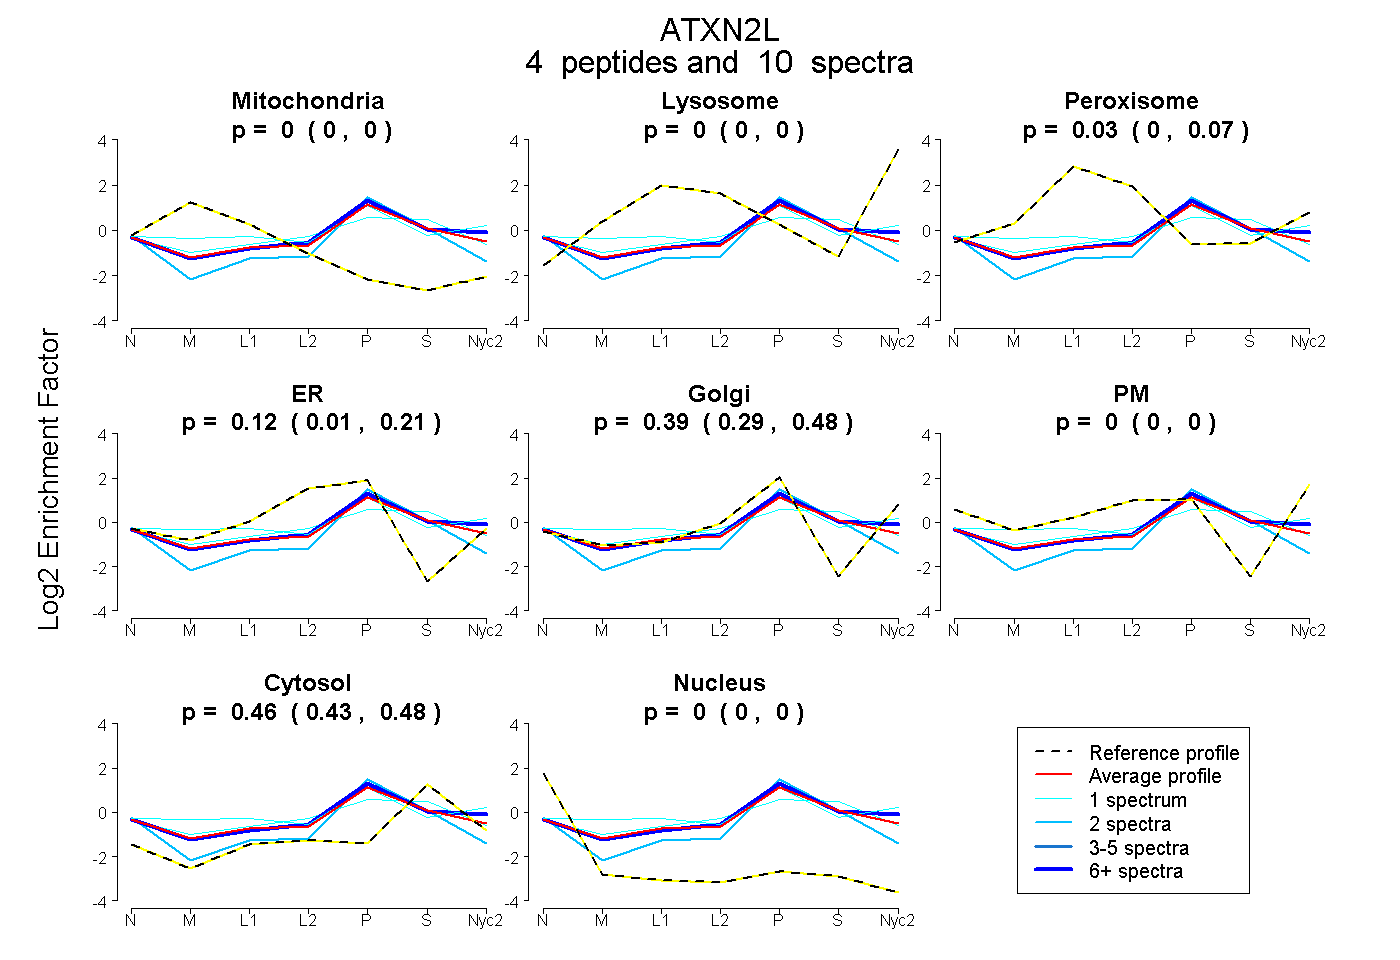
0.000 | 0.003
0.000 | 0.000
0.000 | 0.068
0.012 | 0.214
0.290 | 0.481
0.000 | 0.000
0.425 | 0.484
0.000 | 0.000
3peptides
spectra
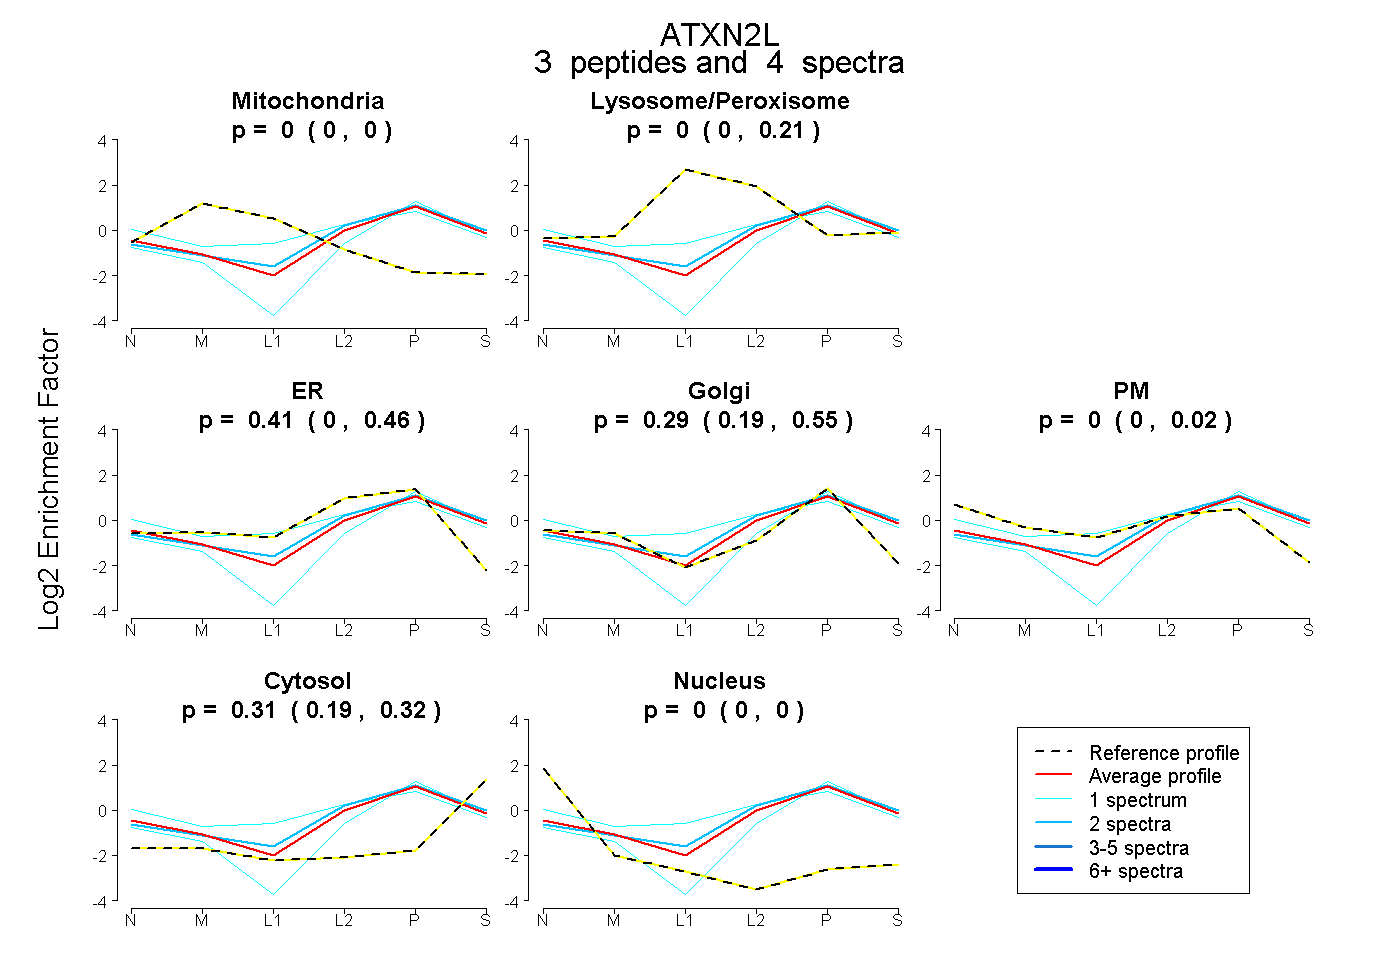
0.000 | 0.000
0.000 | 0.206
0.000 | 0.456
0.195 | 0.553
0.000 | 0.020
0.186 | 0.318
0.000 | 0.000
6peptides
spectra
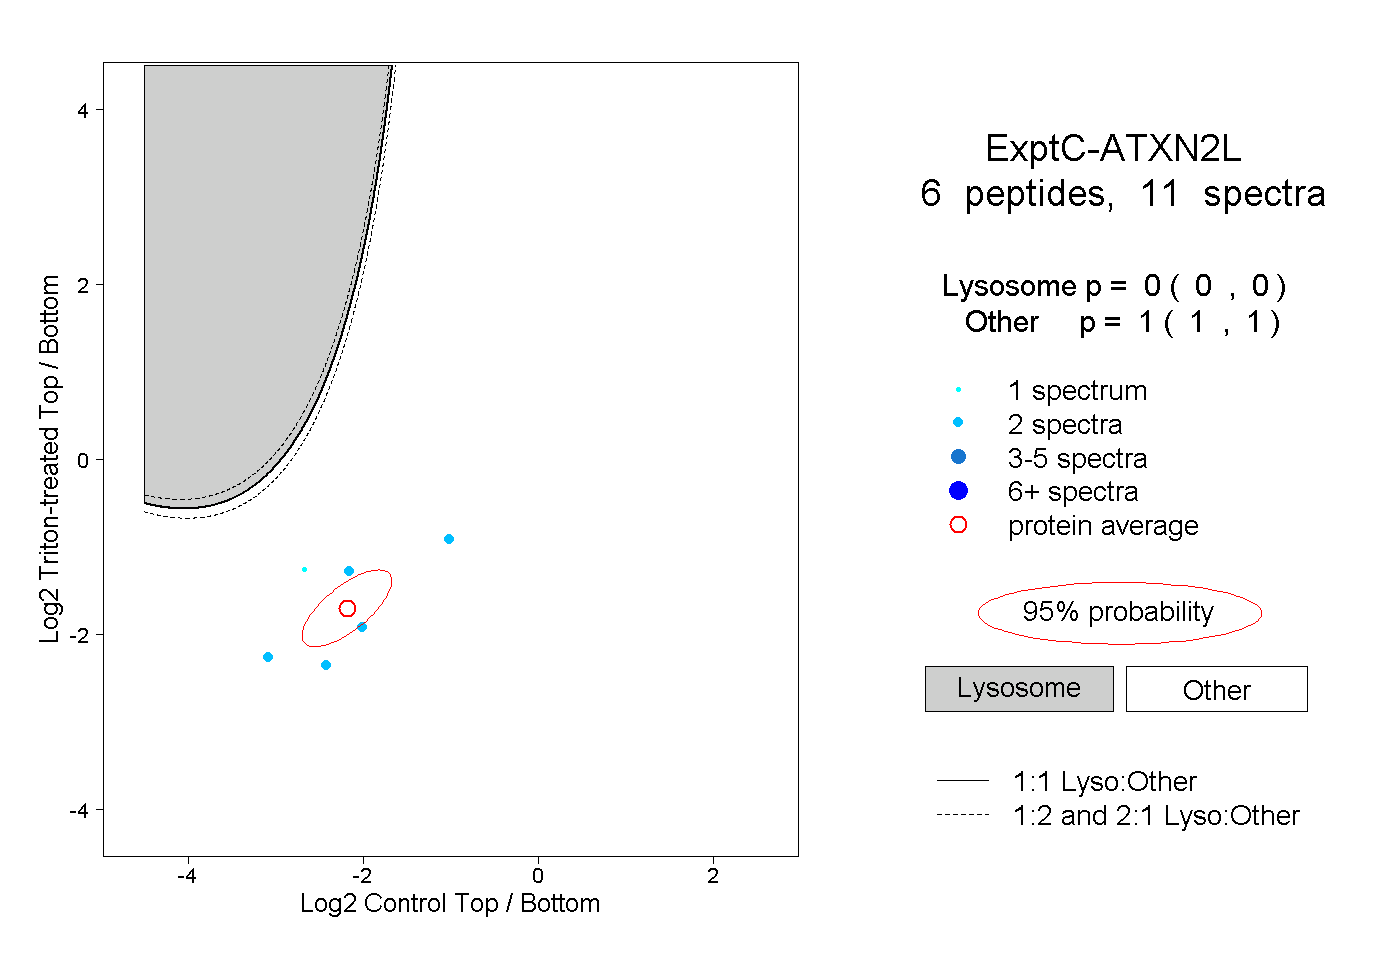
0.000 | 0.000
1.000 | 1.000
1peptide
spectrum
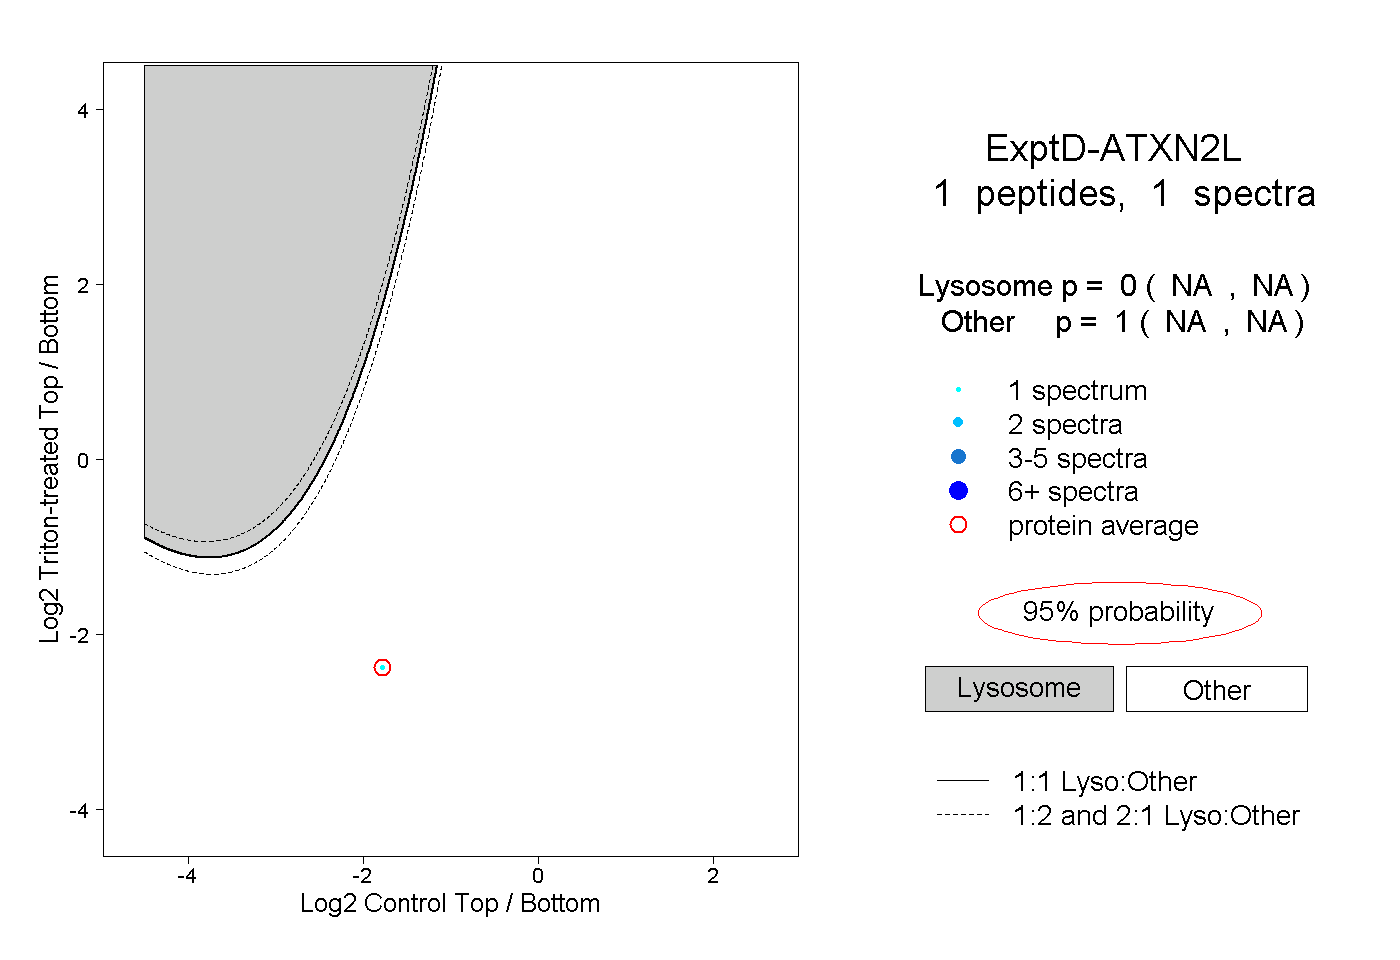
NA | NA
NA | NA