9
9peptides
spectra
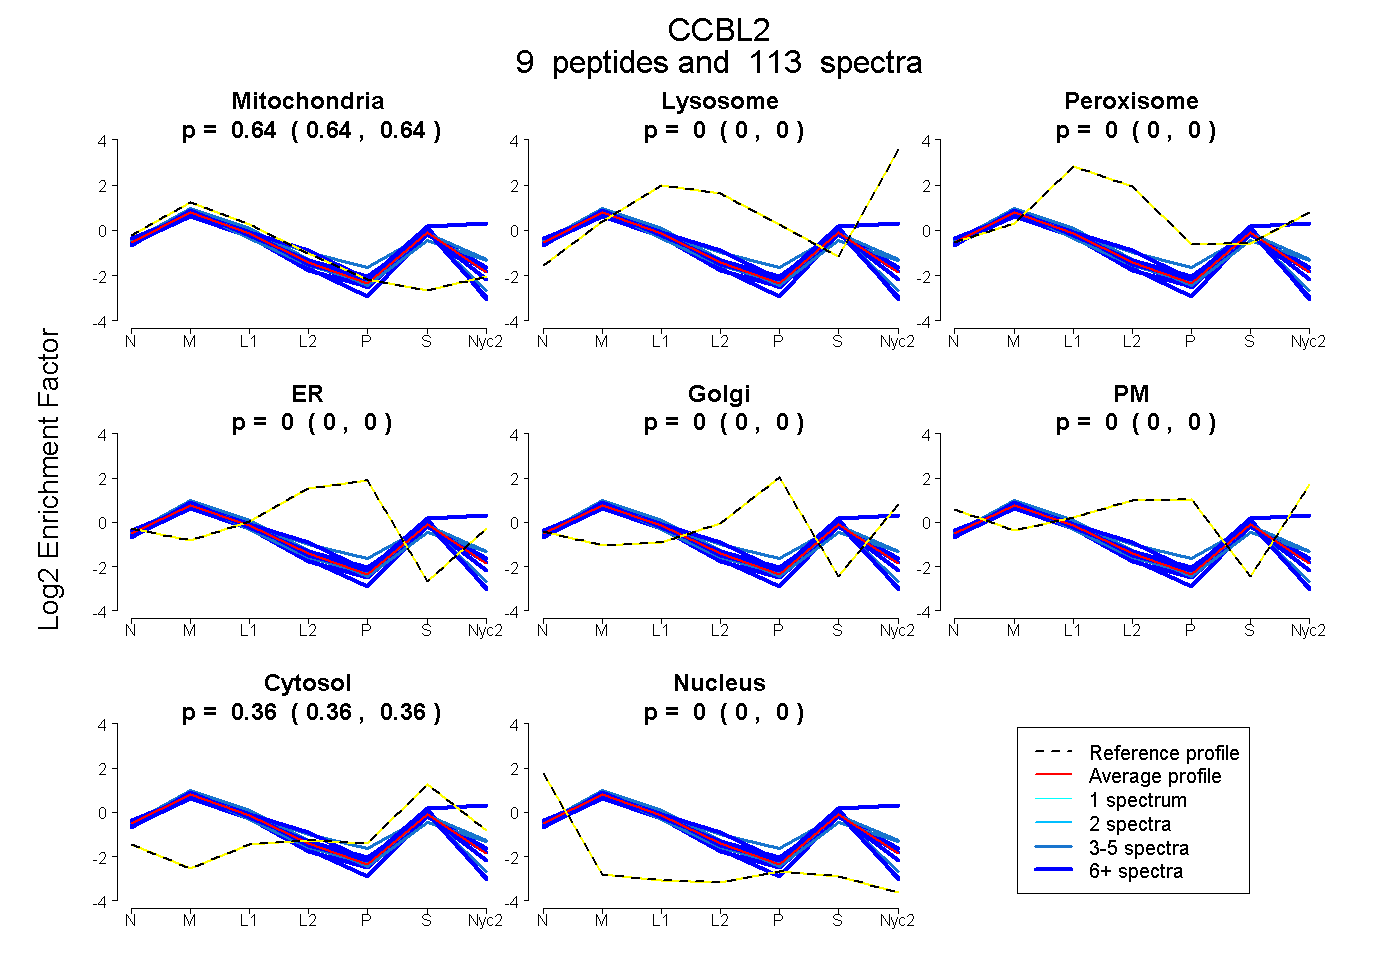
0.639 | 0.644
0.000 | 0.000
0.000 | 0.000
0.000 | 0.000
0.000 | 0.000
0.000 | 0.000
0.356 | 0.361
0.000 | 0.000
6peptides
spectra
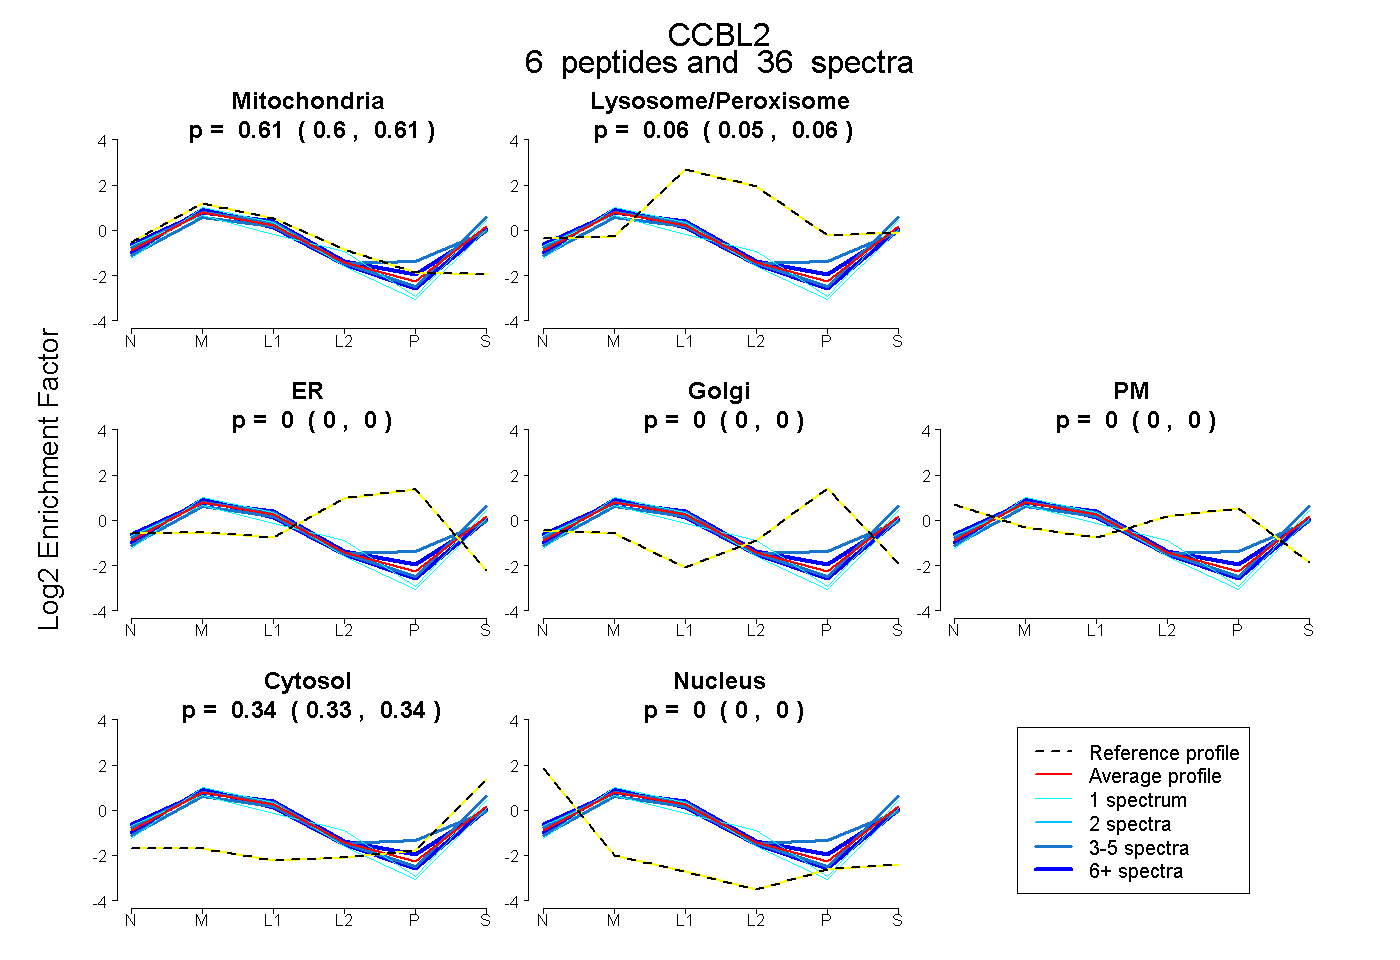
0.597 | 0.615
0.049 | 0.063
0.000 | 0.000
0.000 | 0.000
0.000 | 0.000
0.332 | 0.341
0.000 | 0.000
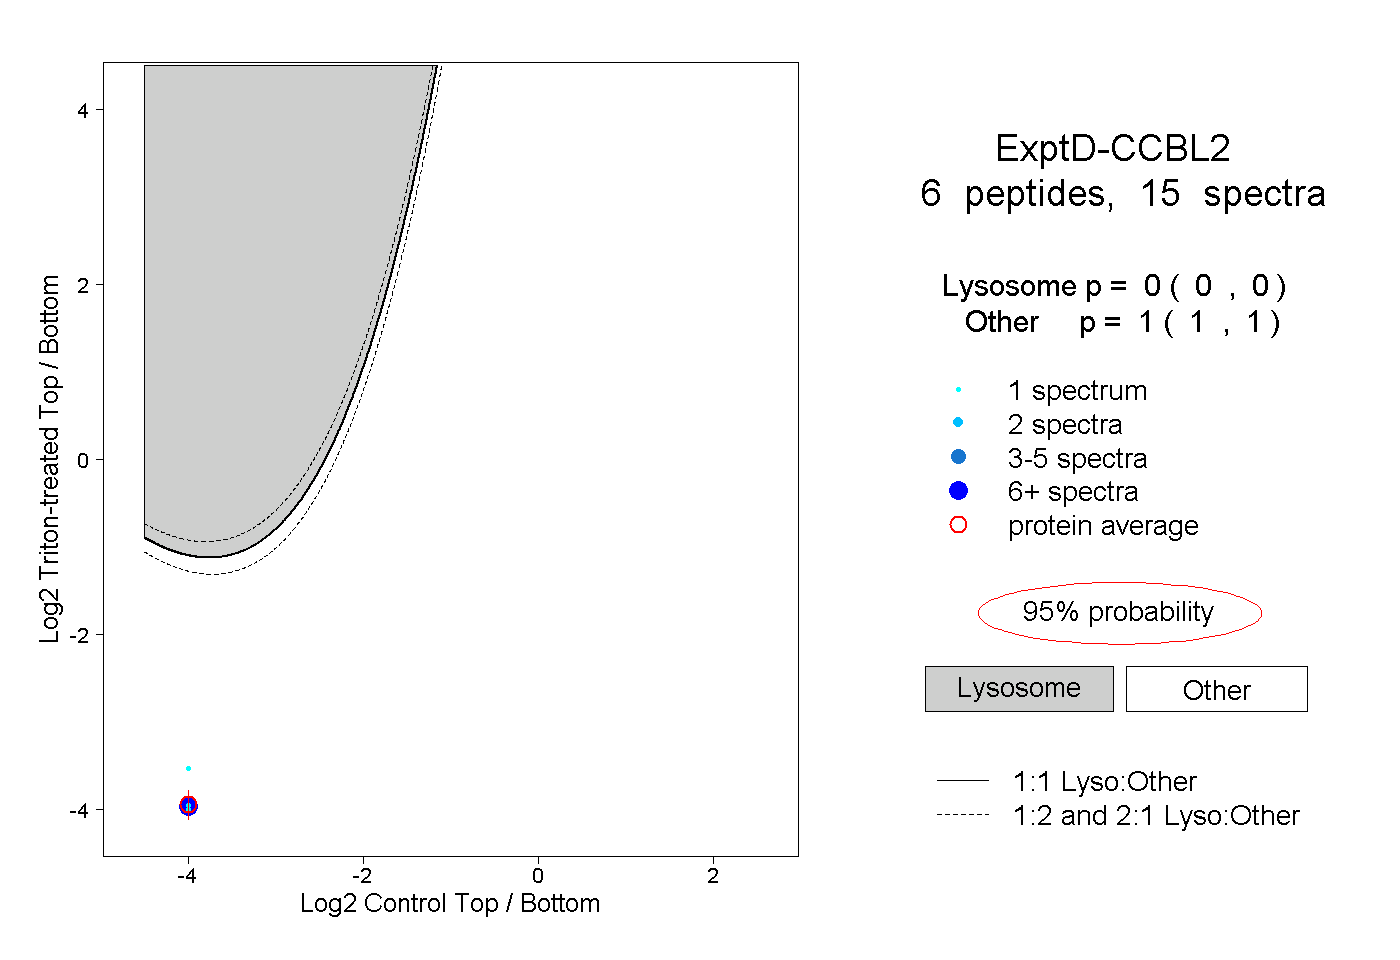
11peptides
spectra
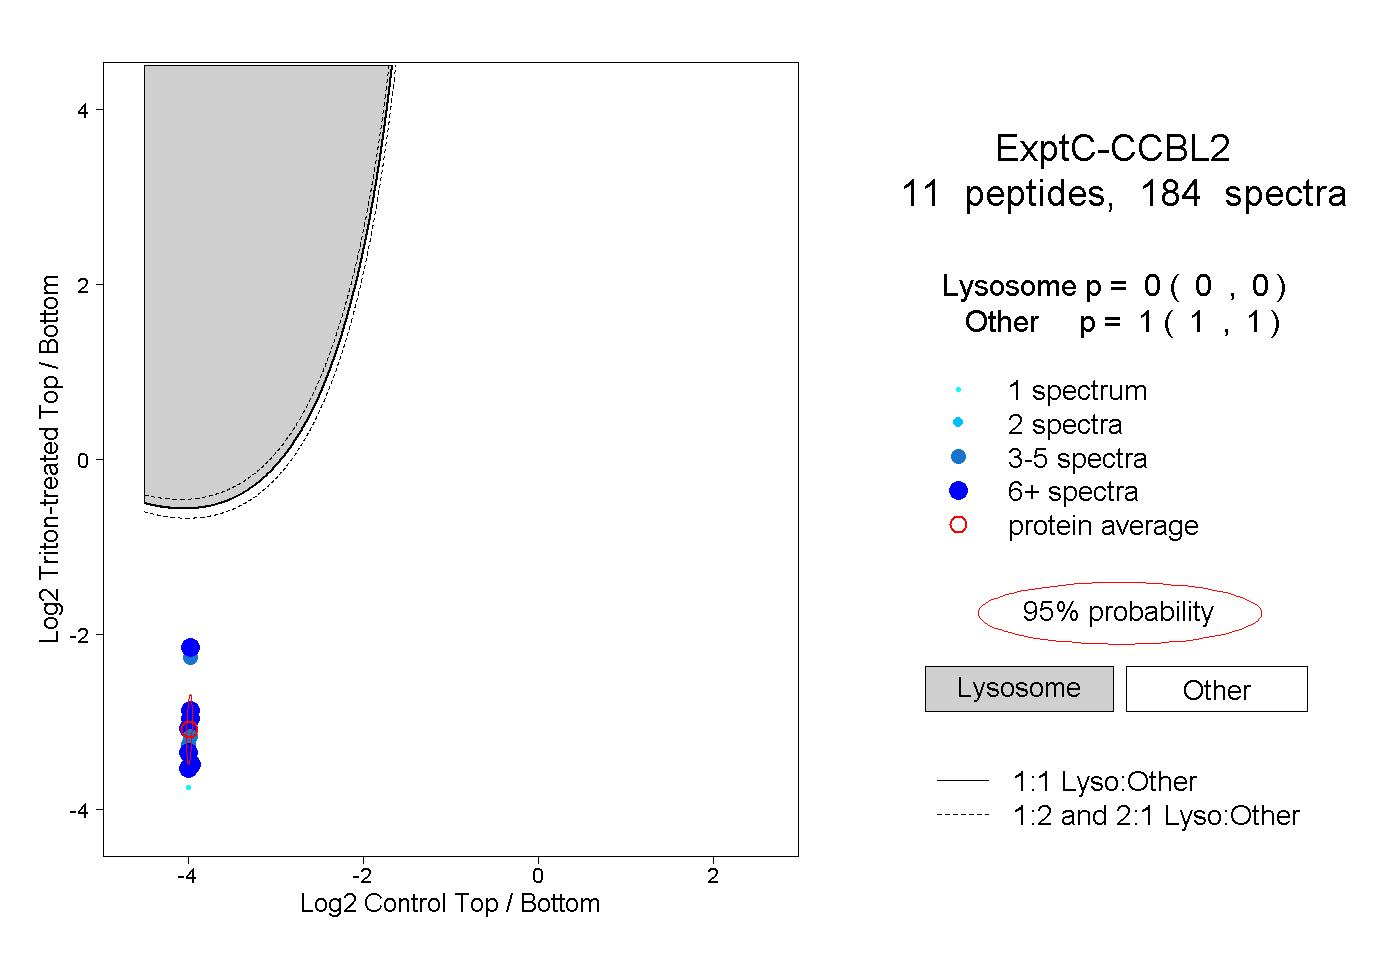
0.000 | 0.000
1.000 | 1.000