 9
9peptides
spectra
0.639 | 0.644
0.000 | 0.000
0.000 | 0.000
0.000 | 0.000
0.000 | 0.000
0.000 | 0.000
0.356 | 0.361
0.000 | 0.000
| Plot | Mito | Lyso | Perox | ER | Golgi | PM | Cytosol | Nucleus | |||||
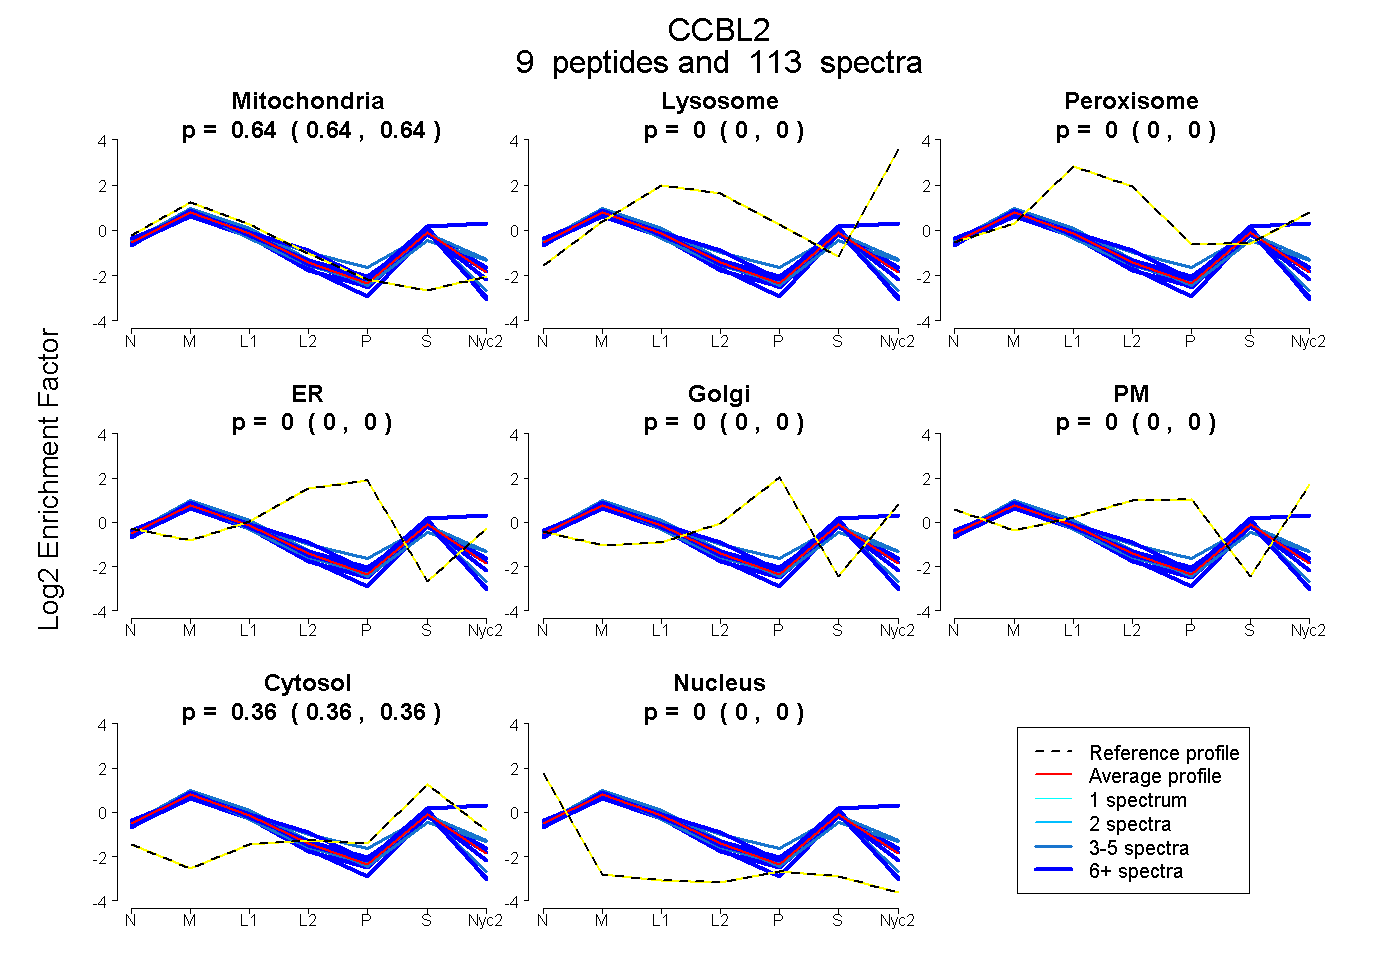
| Expt A |
9 peptides |
113 spectra |
|
0.642 0.639 | 0.644 |
0.000 0.000 | 0.000 |
0.000 0.000 | 0.000 |
0.000 0.000 | 0.000 |
0.000 0.000 | 0.000 |
0.000 0.000 | 0.000 |
0.358 0.356 | 0.361 |
0.000 0.000 | 0.000 |
| 4 spectra, GFGHPSLVK | 0.533 | 0.000 | 0.125 | 0.000 | 0.000 | 0.000 | 0.342 | 0.000 | ||
| 4 spectra, FCFIK | 0.668 | 0.000 | 0.000 | 0.000 | 0.000 | 0.000 | 0.332 | 0.000 | ||
| 21 spectra, MAGAVPVFIPLR | 0.643 | 0.000 | 0.006 | 0.000 | 0.000 | 0.000 | 0.351 | 0.000 | ||
| 3 spectra, IEGLDQNVWVEFTK | 0.655 | 0.000 | 0.062 | 0.000 | 0.000 | 0.000 | 0.283 | 0.000 | ||
| 8 spectra, SDEPYDYK | 0.664 | 0.000 | 0.000 | 0.000 | 0.000 | 0.000 | 0.336 | 0.000 | ||
| 9 spectra, ALSCLYGK | 0.624 | 0.000 | 0.000 | 0.000 | 0.000 | 0.000 | 0.362 | 0.014 | ||
| 23 spectra, AAFIDNLNQYTR | 0.644 | 0.000 | 0.015 | 0.000 | 0.000 | 0.000 | 0.341 | 0.000 | ||
| 31 spectra, DSTLDAAEEIFR | 0.674 | 0.000 | 0.000 | 0.000 | 0.000 | 0.000 | 0.326 | 0.000 | ||
| 10 spectra, LLAQR | 0.390 | 0.234 | 0.000 | 0.000 | 0.000 | 0.000 | 0.376 | 0.000 |
| Plot | Mito | Lyso or Perox | ER | Golgi | PM | Cytosol | Nucleus | ||||||
| Expt B |
6 peptides |
36 spectra |
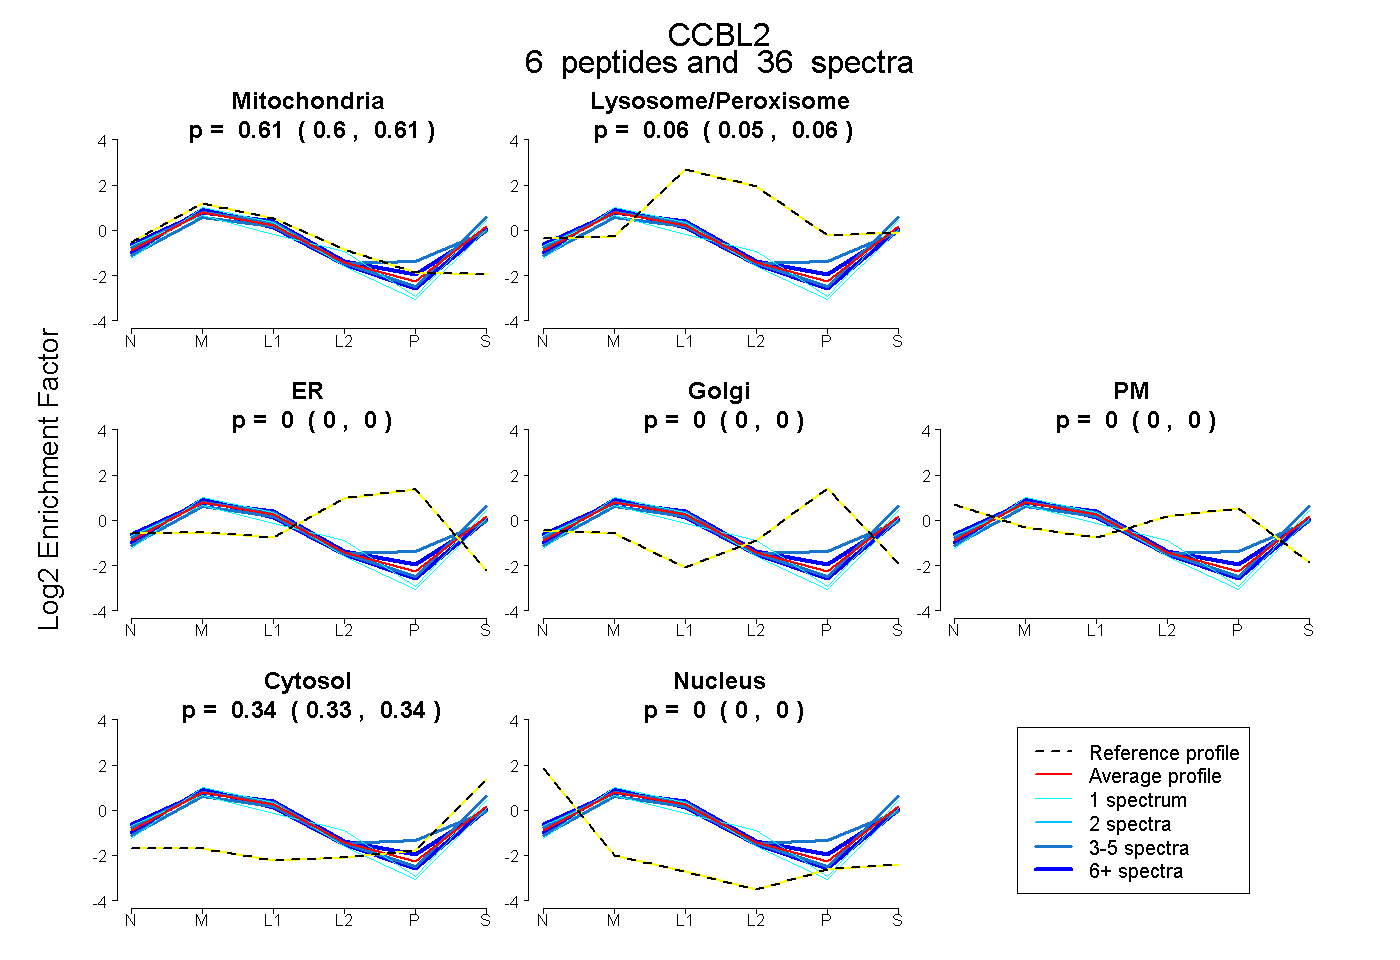 |
0.606 0.597 | 0.615 |
0.057 0.049 | 0.063 |
0.000 0.000 | 0.000 |
0.000 0.000 | 0.000 |
0.000 0.000 | 0.000 |
0.337 0.332 | 0.341 |
0.000 0.000 | 0.000 |
|||
| Plot | Lyso | Other | |||||||||||
| Expt C |
11 peptides |
184 spectra |
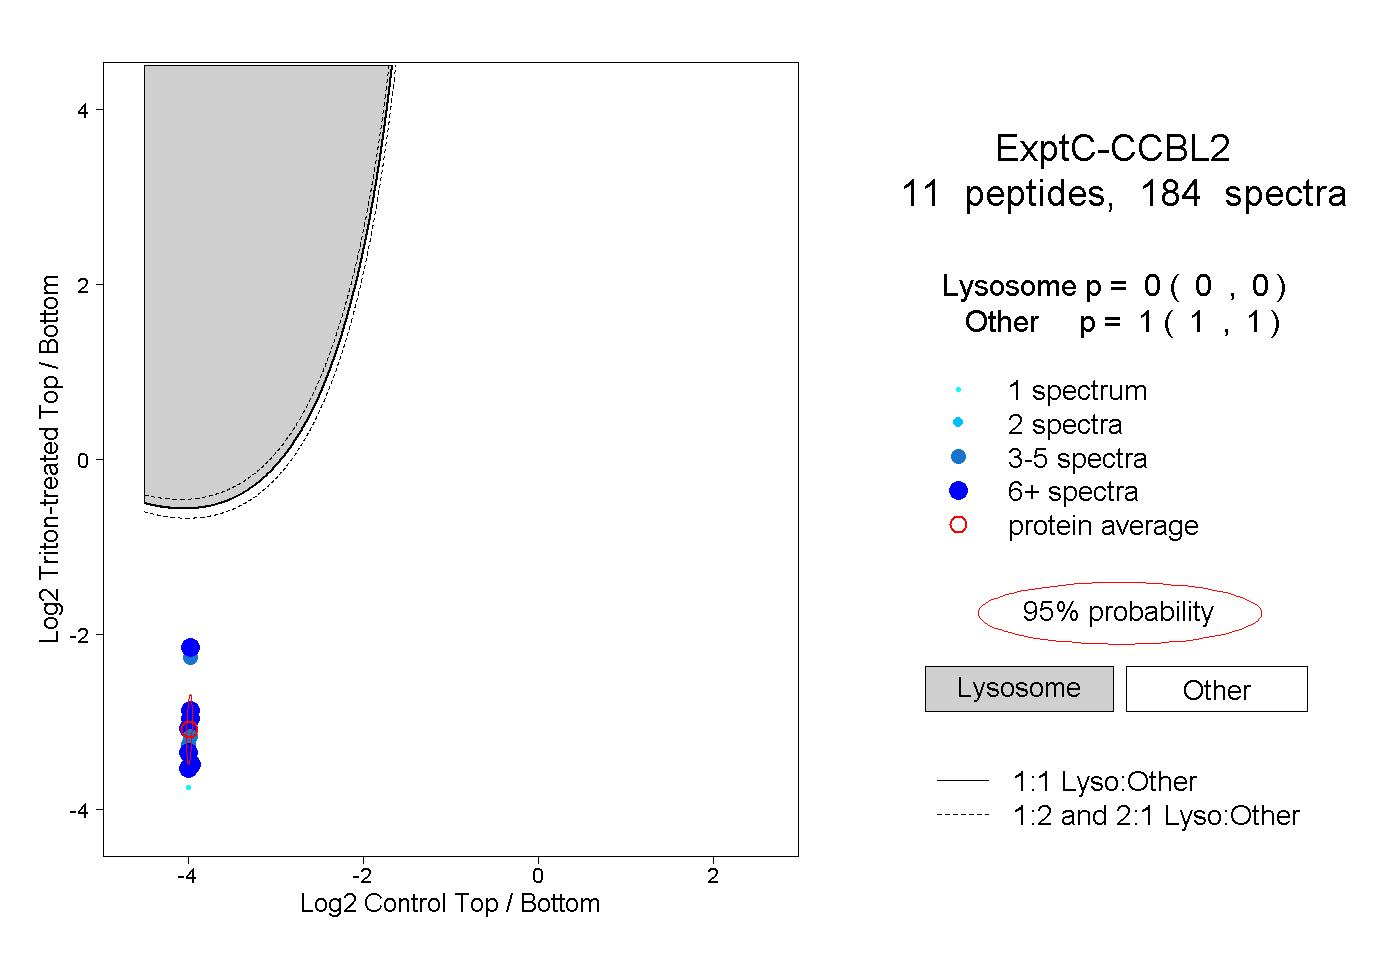 |
0.000 0.000 | 0.000 |
1.000 1.000 | 1.000 |
||||||||
| Plot | Lyso | Other | |||||||||||
| Expt D |
6 peptides |
15 spectra |
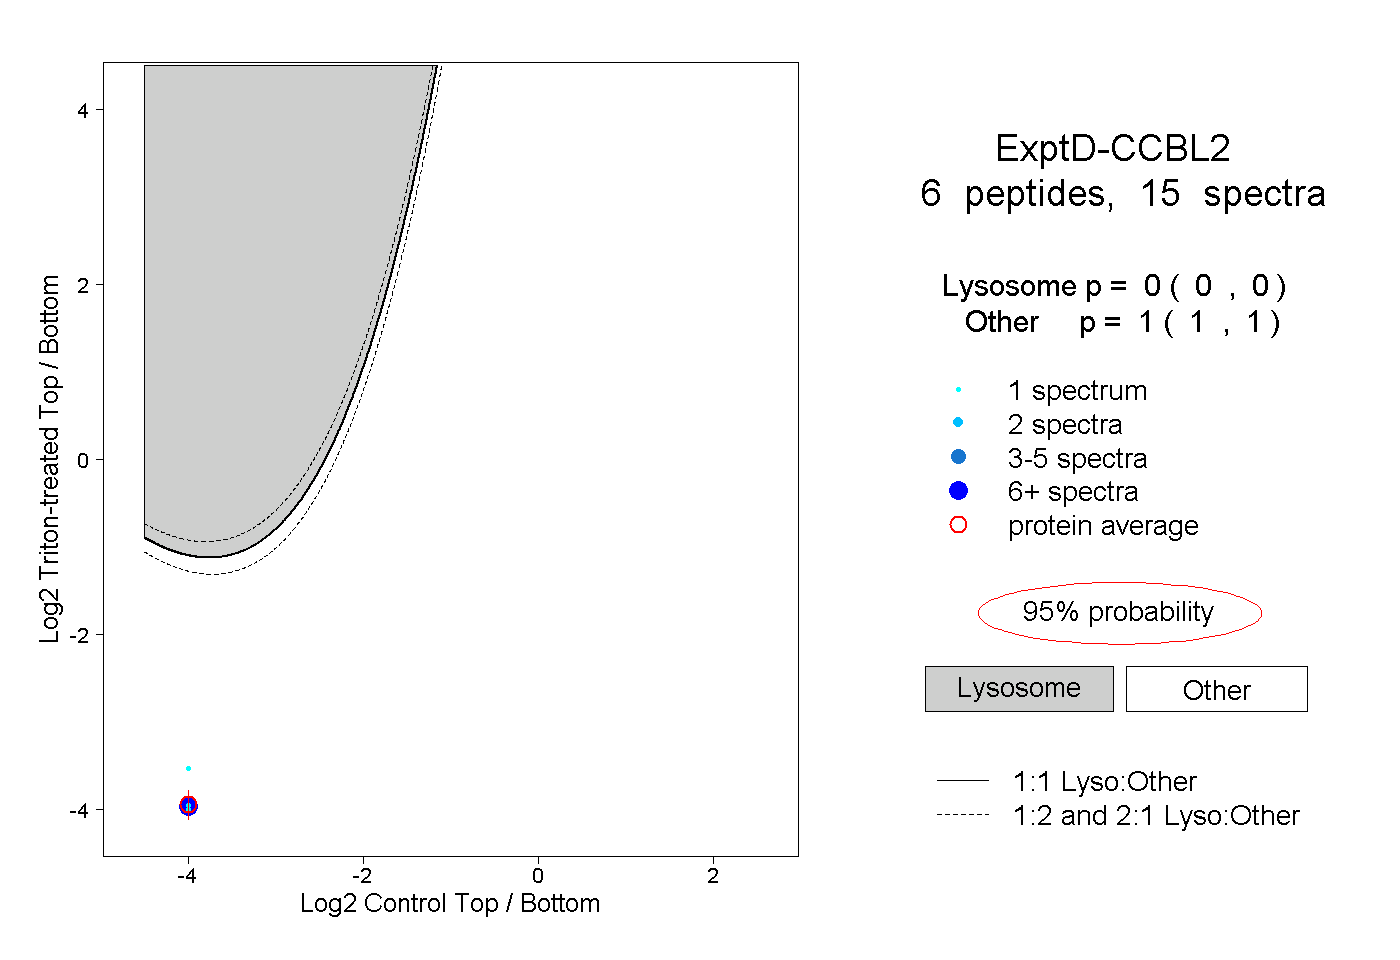 |
0.000 0.000 | 0.000 |
1.000 1.000 | 1.000 |