 50
50peptides
spectra
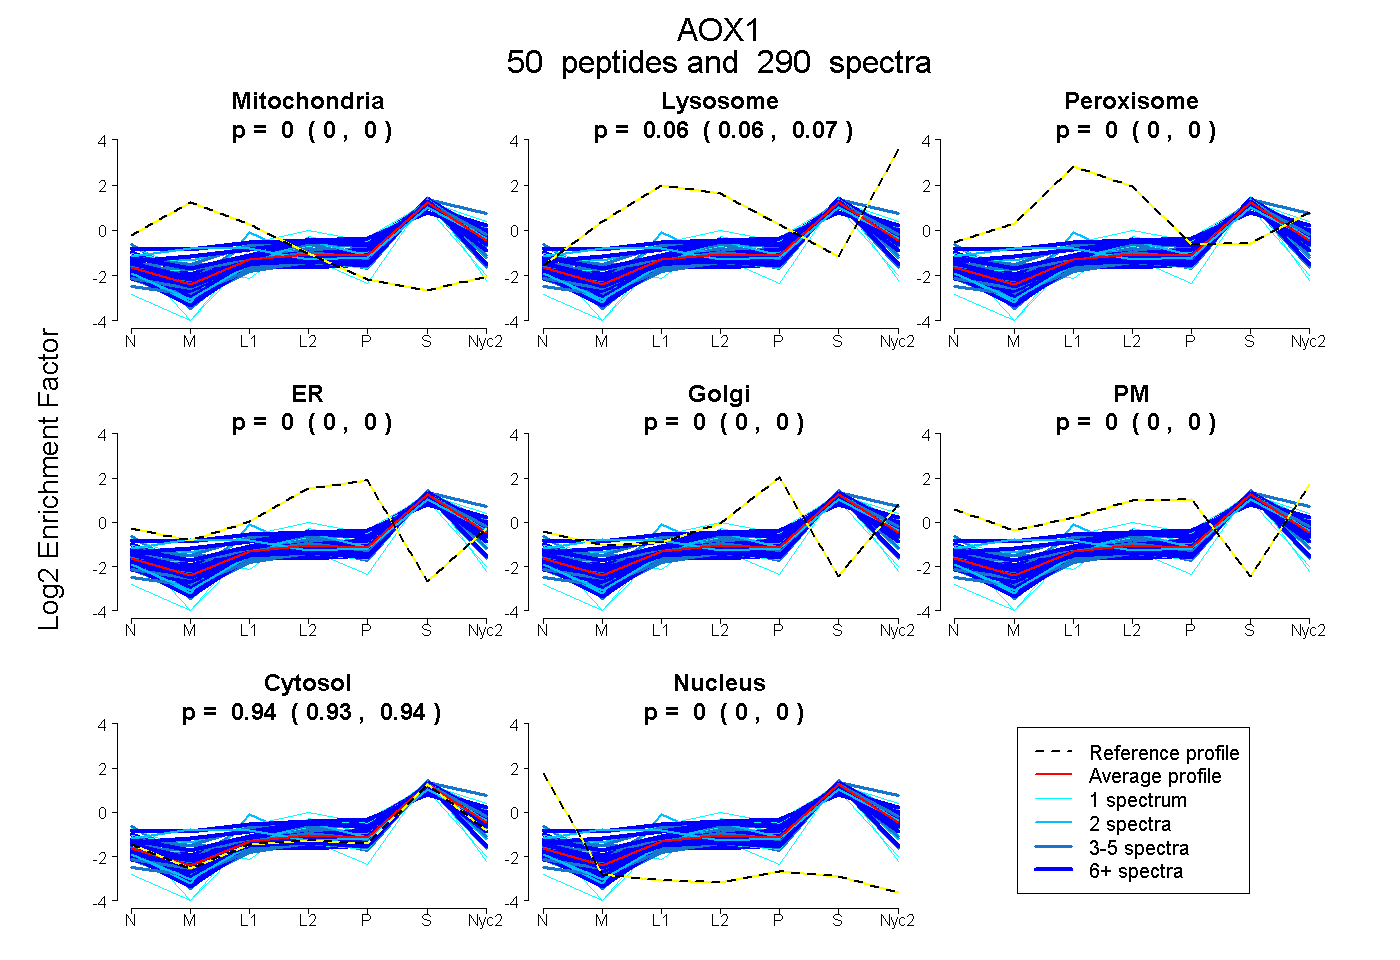
0.000 | 0.000
0.063 | 0.065
0.000 | 0.000
0.000 | 0.000
0.000 | 0.000
0.000 | 0.000
0.935 | 0.937
0.000 | 0.000
26peptides
spectra
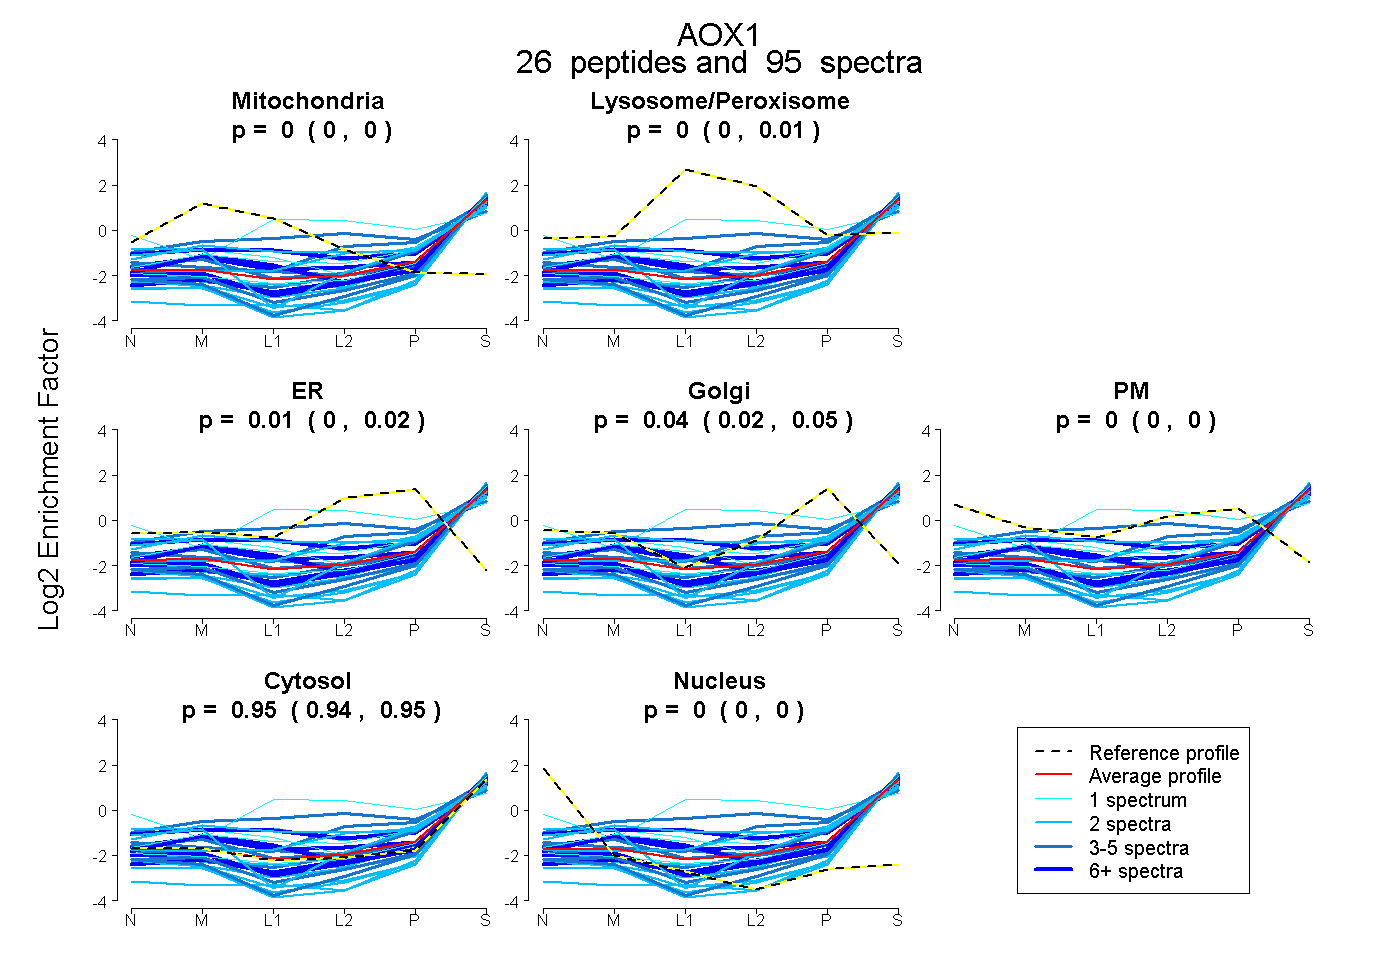
0.000 | 0.000
0.000 | 0.006
0.000 | 0.025
0.023 | 0.054
0.000 | 0.000
0.942 | 0.951
0.000 | 0.000
42peptides
spectra
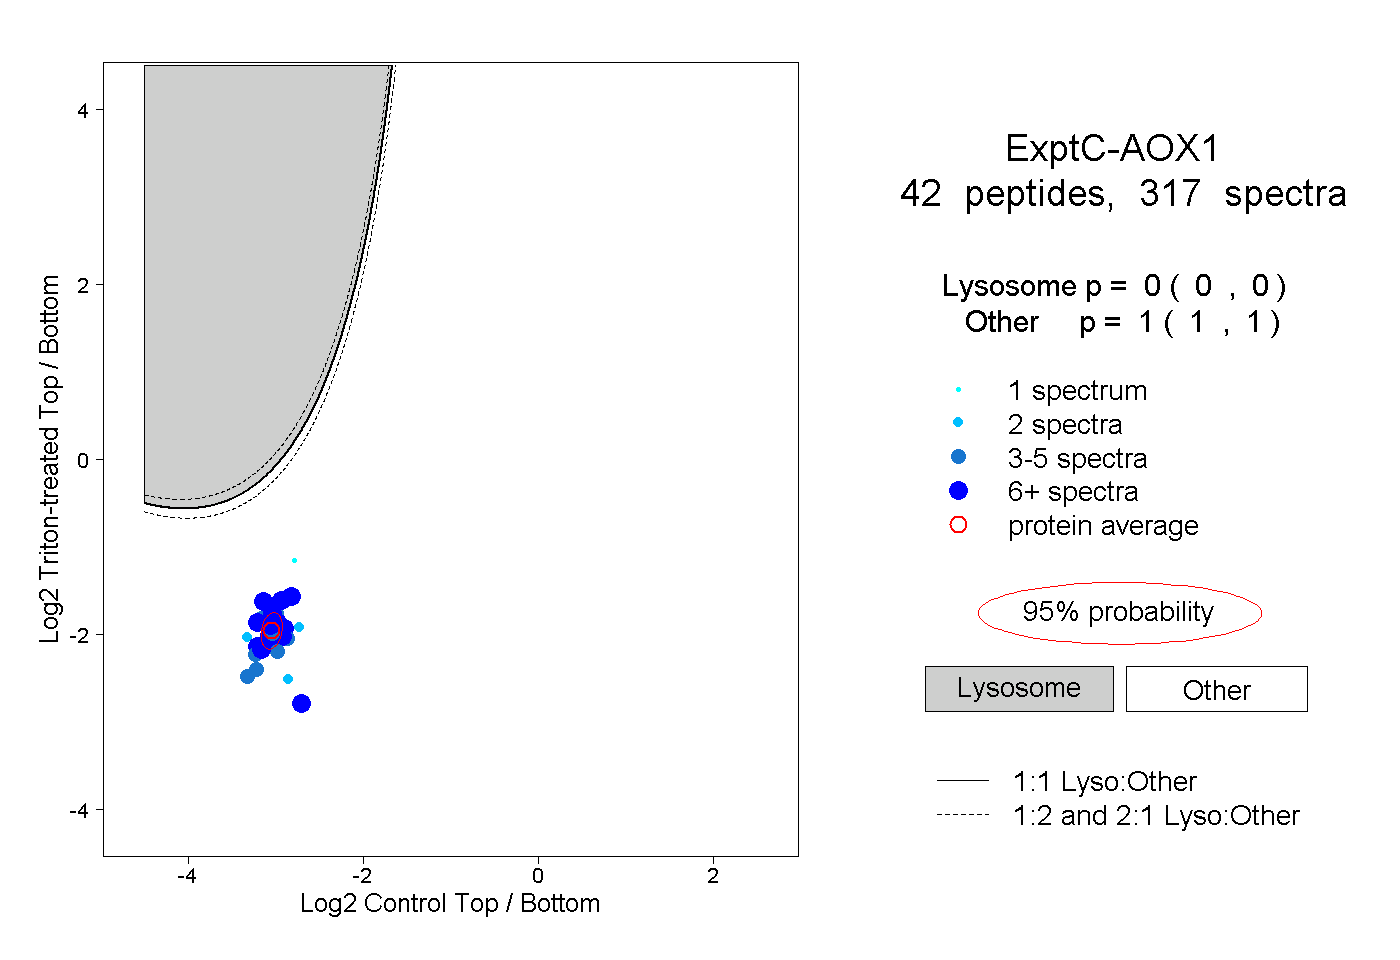
0.000 | 0.000
1.000 | 1.000
10peptides
spectra
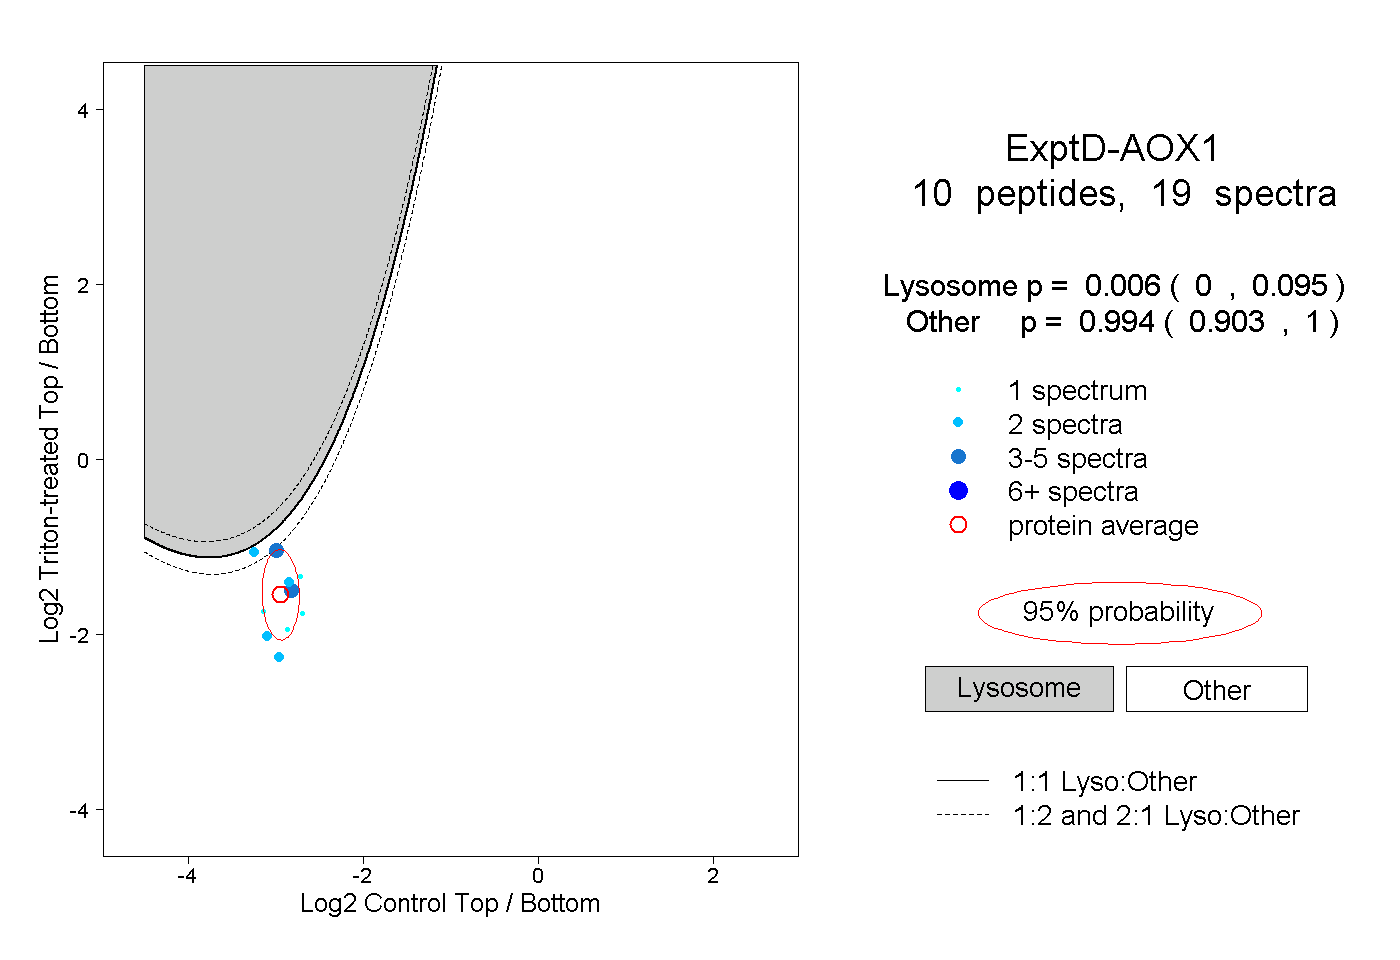
0.000 | 0.095
0.903 | 1.000