AOX1
[ENSRNOP00000059651]
Main page
| | | Plot |
Mito |
Lyso |
|
Perox |
ER |
Golgi |
PM |
Cytosol |
Nucleus |
|
| Expt A |
 50
50
peptides |
290
spectra |
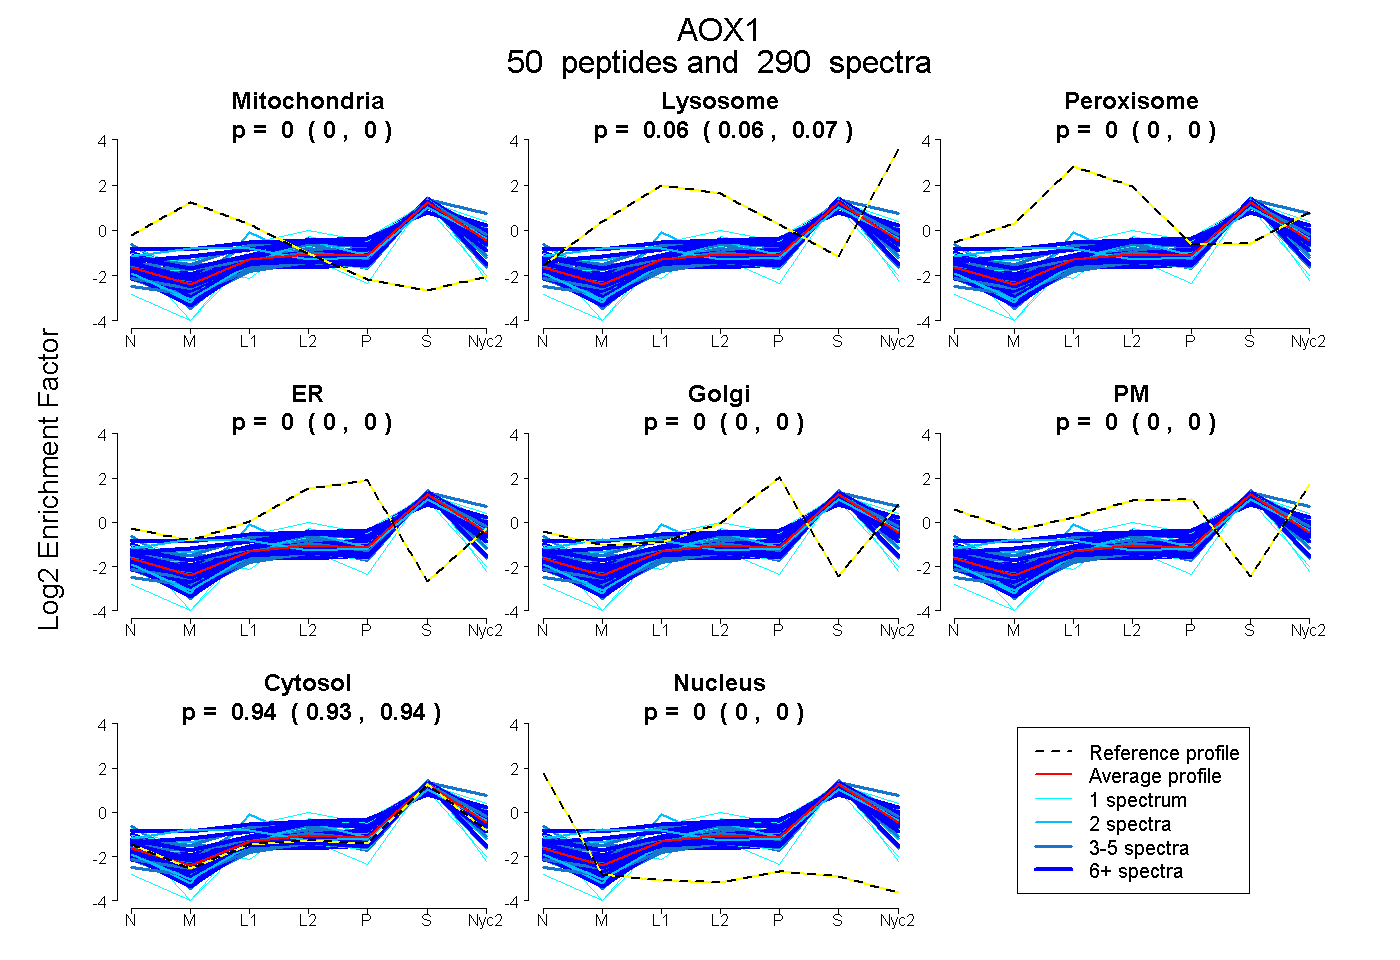 |
0.000
0.000 | 0.000 |
0.064
0.063 | 0.065 |
|
0.000
0.000 | 0.000 |
0.000
0.000 | 0.000 |
0.000
0.000 | 0.000 |
0.000
0.000 | 0.000 |
0.936
0.935 | 0.937 |
0.000
0.000 | 0.000 |
|
| | | Plot |
Mito |
|
Lyso or Perox |
|
ER |
Golgi |
PM |
Cytosol |
Nucleus |
|
| Expt B |
26
peptides |
95
spectra |
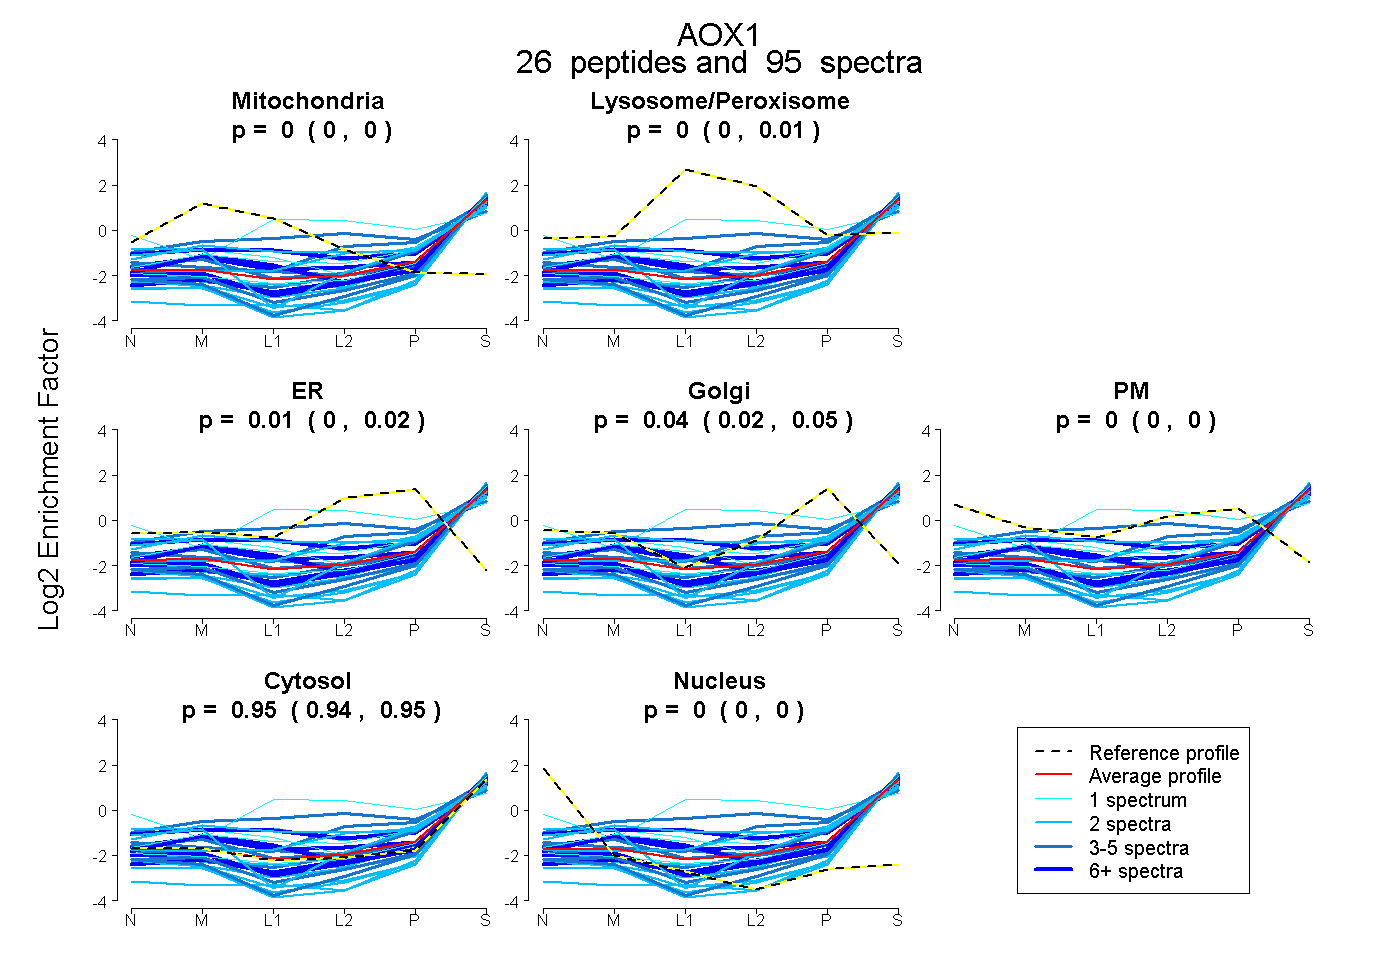 |
0.000
0.000 | 0.000 |
|
0.000
0.000 | 0.006 |
|
0.012
0.000 | 0.025 |
0.040
0.023 | 0.054 |
0.000
0.000 | 0.000 |
0.948
0.942 | 0.951 |
0.000
0.000 | 0.000 |
|
| | | Plot |
|
Lyso |
|
|
|
|
|
|
|
Other |
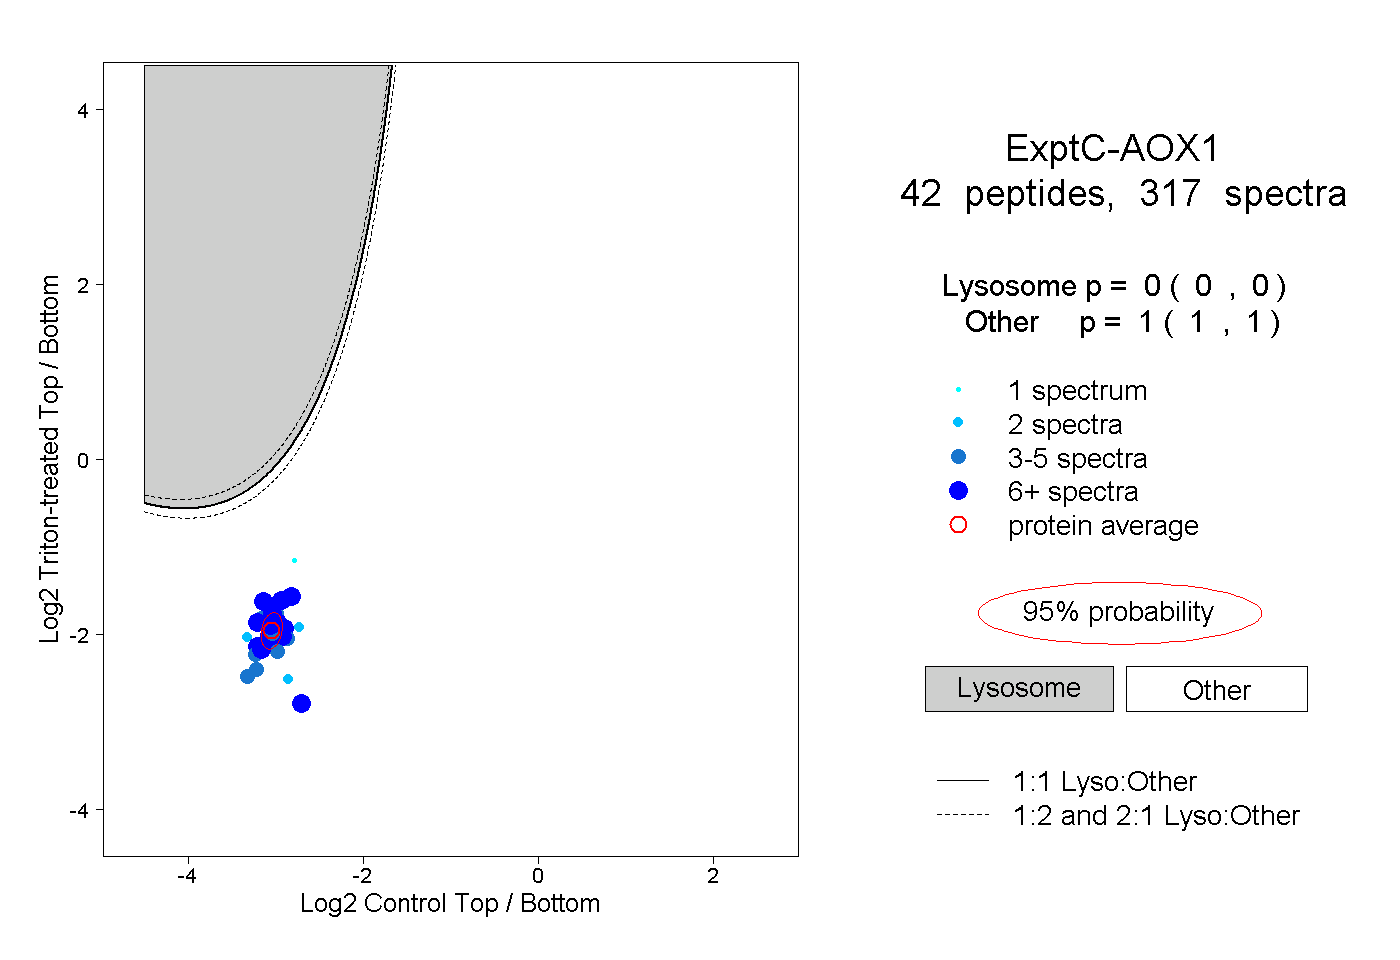
| Expt C |
42
peptides |
317
spectra |
 |
|
0.000
0.000 | 0.000 |
|
|
|
|
|
|
|
1.000
1.000 | 1.000 |
| | | Plot |
|
Lyso |
|
|
|
|
|
|
|
Other |
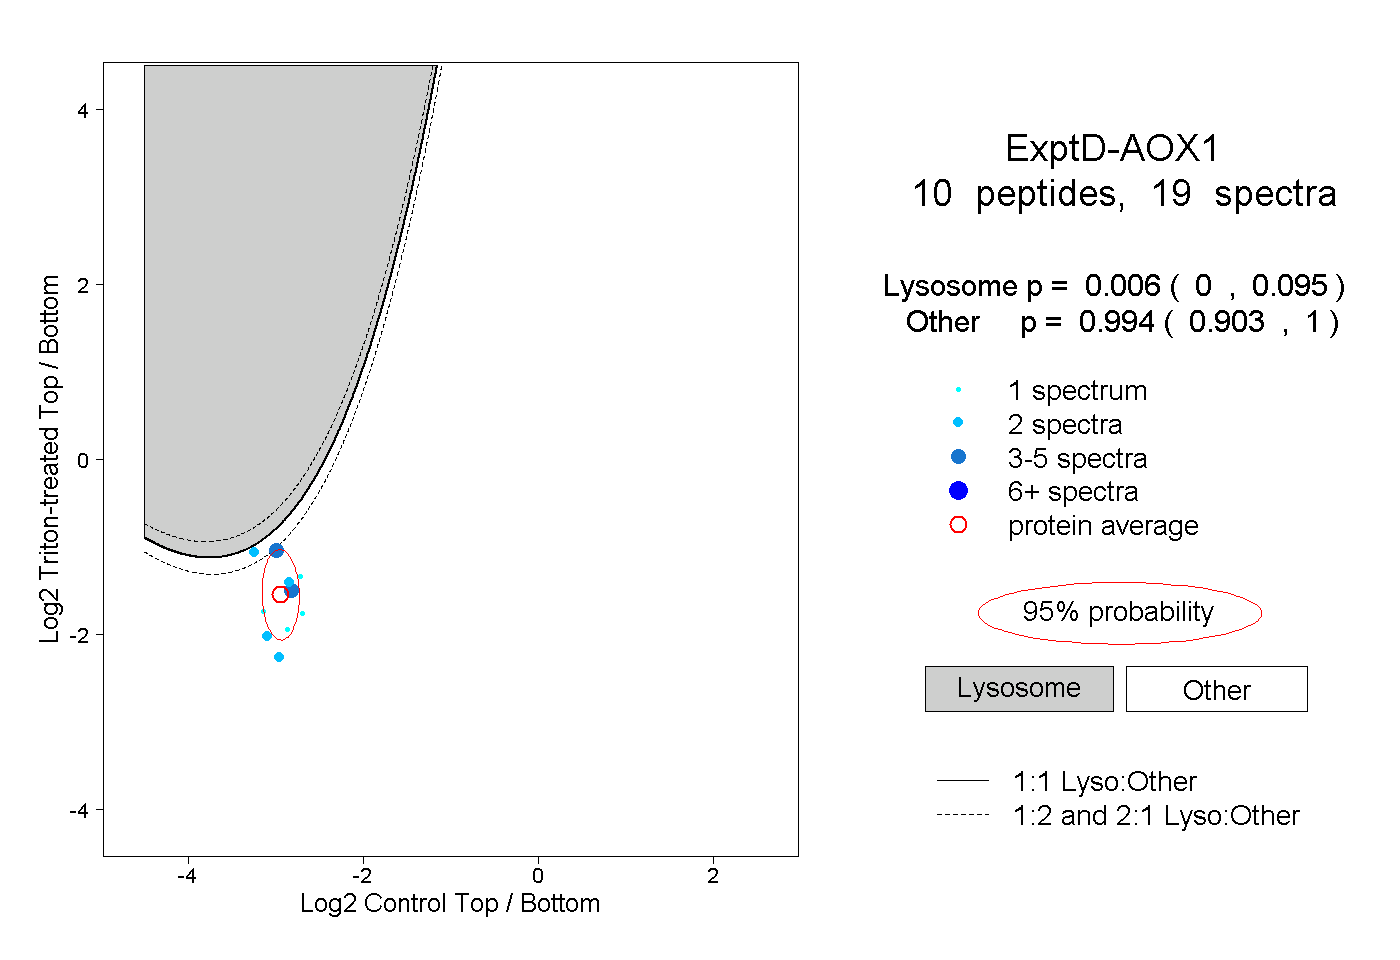
| Expt D |
10
peptides |
19
spectra |
 |
|
0.006
0.000 | 0.095 |
|
|
|
|
|
|
|
0.994
0.903 | 1.000 |
| 1 spectrum, TLFECWR |
|
0.005 |
|
|
|
|
|
|
|
0.995 |
| 4 spectra, MIQVVSR |
|
0.004 |
|
|
|
|
|
|
|
0.996 |
| 1 spectrum, CGLSPEQVR |
|
0.006 |
|
|
|
|
|
|
|
0.994 |
| 1 spectrum, LTSPLTPEK |
|
0.000 |
|
|
|
|
|
|
|
1.000 |
| 2 spectra, QEFSAK |
|
0.008 |
|
|
|
|
|
|
|
0.992 |
| 3 spectra, LPEETTQTYR |
|
0.166 |
|
|
|
|
|
|
|
0.834 |
| 2 spectra, VGGAFGGK |
|
0.001 |
|
|
|
|
|
|
|
0.999 |
| 2 spectra, GEDMLITGGR |
|
0.000 |
|
|
|
|
|
|
|
1.000 |
| 1 spectrum, TLAGSQIR |
|
0.000 |
|
|
|
|
|
|
|
1.000 |
| 2 spectra, QIDNTHYK |
|
0.367 |
|
|
|
|
|
|
|
0.633 |