| 2 spectra, TLFECWR |
0.000 |
|
0.000 |
|
0.000 |
0.000 |
0.000 |
0.999 |
0.001 |
|
| 2 spectra, DLEPLILTIEEAIQHK |
0.000 |
|
0.000 |
|
0.000 |
0.000 |
0.000 |
1.000 |
0.000 |
|
| 2 spectra, YGCGGGGCGACTVMISR |
0.000 |
|
0.000 |
|
0.000 |
0.231 |
0.000 |
0.769 |
0.000 |
|
| 5 spectra, ELSILYGGVGPTTIGAK |
0.000 |
|
0.413 |
|
0.000 |
0.127 |
0.000 |
0.460 |
0.000 |
|
| 2 spectra, CGLSPEQVR |
0.000 |
|
0.000 |
|
0.000 |
0.000 |
0.000 |
1.000 |
0.000 |
|
| 2 spectra, HPYLGK |
0.000 |
|
0.000 |
|
0.000 |
0.000 |
0.000 |
1.000 |
0.000 |
|
| 1 spectrum, LVLDEVTLAGSAPGGK |
0.039 |
|
0.119 |
|
0.000 |
0.124 |
0.000 |
0.718 |
0.000 |
|
| 6 spectra, QQNALAIVNSGMR |
0.083 |
|
0.020 |
|
0.000 |
0.000 |
0.000 |
0.897 |
0.000 |
|
| 5 spectra, MTWISPVTLEELVEAK |
0.000 |
|
0.048 |
|
0.000 |
0.000 |
0.000 |
0.952 |
0.000 |
|
| 1 spectrum, GYESNINWEK |
0.000 |
|
0.552 |
|
0.000 |
0.098 |
0.036 |
0.314 |
0.000 |
|
| 4 spectra, SFFESER |
0.000 |
|
0.000 |
|
0.000 |
0.000 |
0.000 |
1.000 |
0.000 |
|
| 7 spectra, NHPEPSLDQLTDALGGNLCR |
0.017 |
|
0.249 |
|
0.000 |
0.045 |
0.000 |
0.689 |
0.000 |
|
| 14 spectra, MIQVVSR |
0.000 |
|
0.000 |
|
0.000 |
0.000 |
0.000 |
1.000 |
0.000 |
|
| 2 spectra, VHCVGQLVCAVIADSETR |
0.005 |
|
0.268 |
|
0.000 |
0.070 |
0.000 |
0.658 |
0.000 |
|
| 3 spectra, QIPLSEQFLR |
0.000 |
|
0.013 |
|
0.000 |
0.139 |
0.000 |
0.847 |
0.000 |
|
| 2 spectra, LIGRPWNEEMLDTACR |
0.000 |
|
0.000 |
|
0.000 |
0.000 |
0.000 |
1.000 |
0.000 |
|
| 4 spectra, TNLPSNTALR |
0.000 |
|
0.000 |
|
0.000 |
0.000 |
0.000 |
1.000 |
0.000 |
|
| 1 spectrum, VFYSNR |
0.000 |
|
0.160 |
|
0.000 |
0.075 |
0.000 |
0.765 |
0.000 |
|
| 4 spectra, IHPVQER |
0.000 |
|
0.081 |
|
0.184 |
0.000 |
0.000 |
0.735 |
0.000 |
|
| 2 spectra, LPEETTQTYR |
0.000 |
|
0.000 |
|
0.000 |
0.000 |
0.000 |
1.000 |
0.000 |
|
| 1 spectrum, VGGAFGGK |
0.000 |
|
0.000 |
|
0.000 |
0.000 |
0.000 |
1.000 |
0.000 |
|
| 8 spectra, TLAGSQIR |
0.000 |
|
0.000 |
|
0.000 |
0.000 |
0.000 |
1.000 |
0.000 |
|
| 5 spectra, GEDMLITGGR |
0.000 |
|
0.000 |
|
0.000 |
0.000 |
0.000 |
1.000 |
0.000 |
|
| 2 spectra, VMCHVR |
0.000 |
|
0.079 |
|
0.124 |
0.000 |
0.000 |
0.798 |
0.000 |
|
| 6 spectra, GVFHPIIISPDR |
0.008 |
|
0.101 |
|
0.000 |
0.025 |
0.000 |
0.866 |
0.000 |
|
| 2 spectra, HIQDIVAATLK |
0.000 |
|
0.223 |
|
0.000 |
0.047 |
0.086 |
0.644 |
0.000 |
|
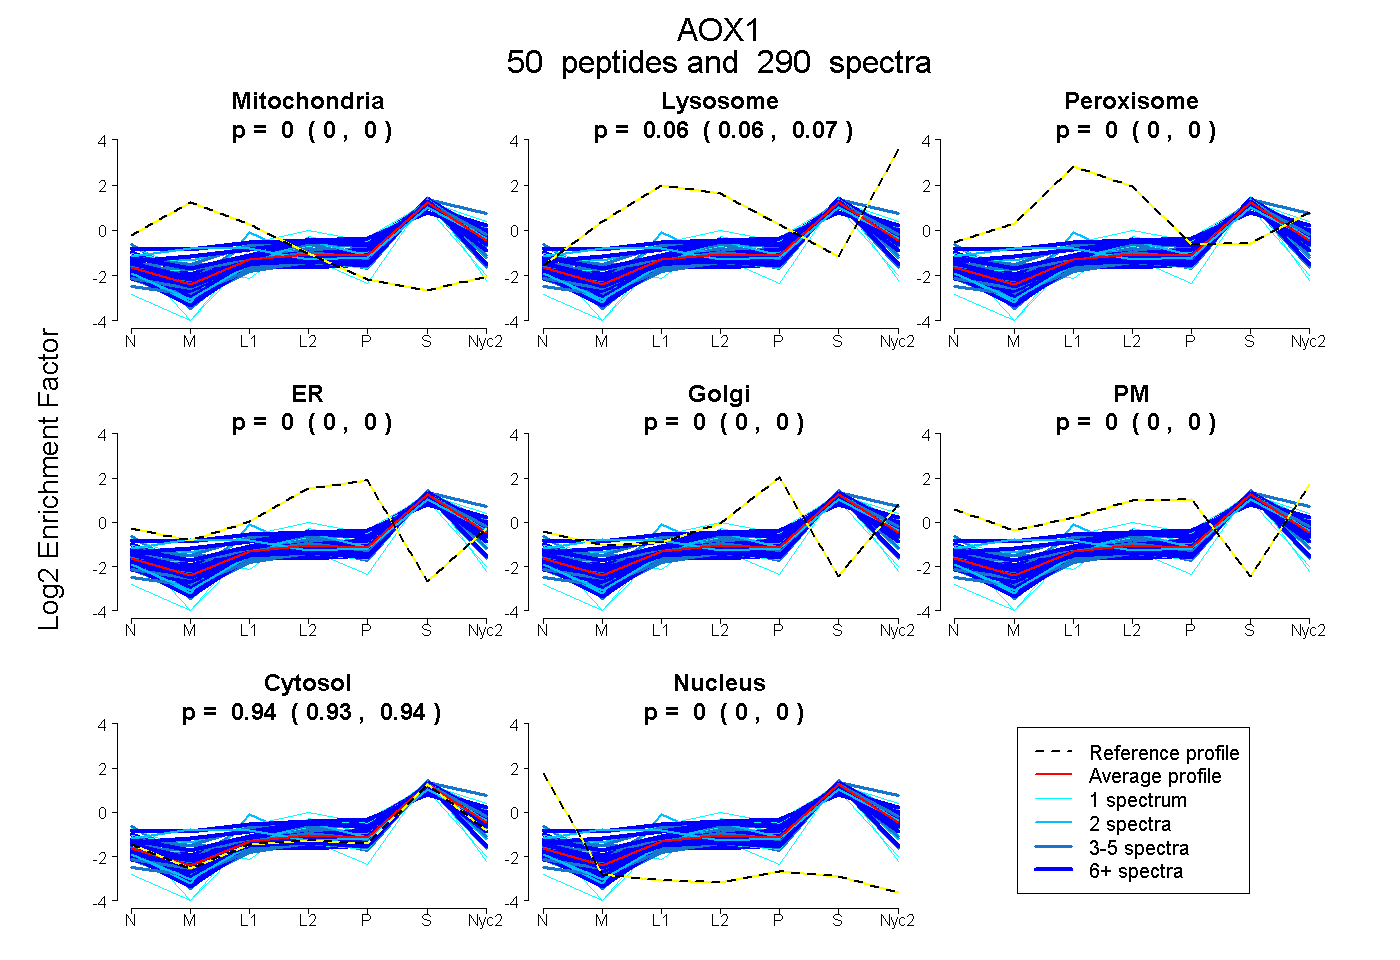
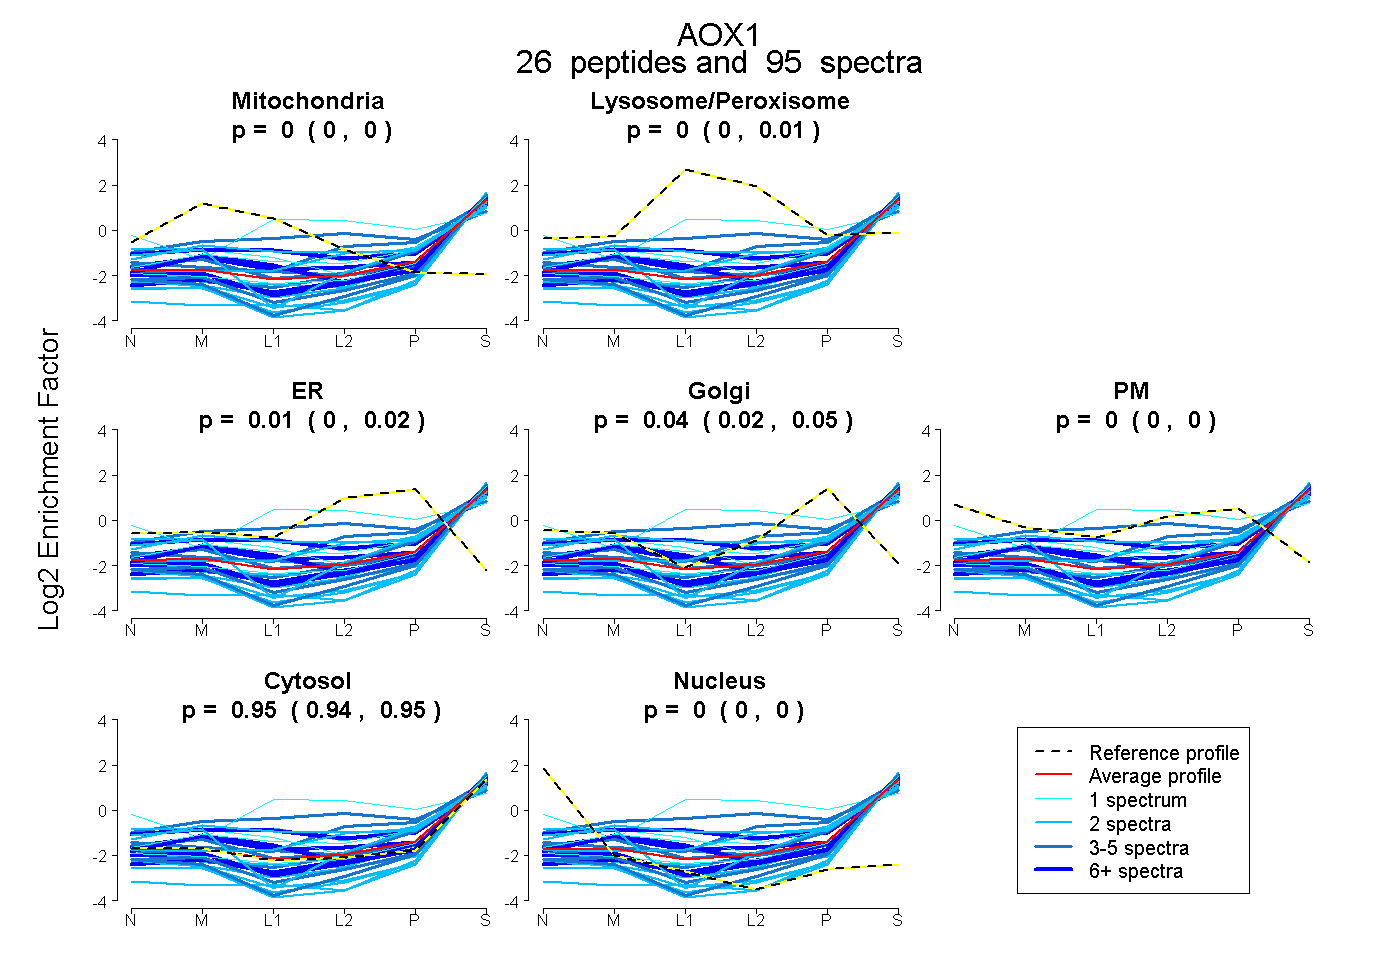
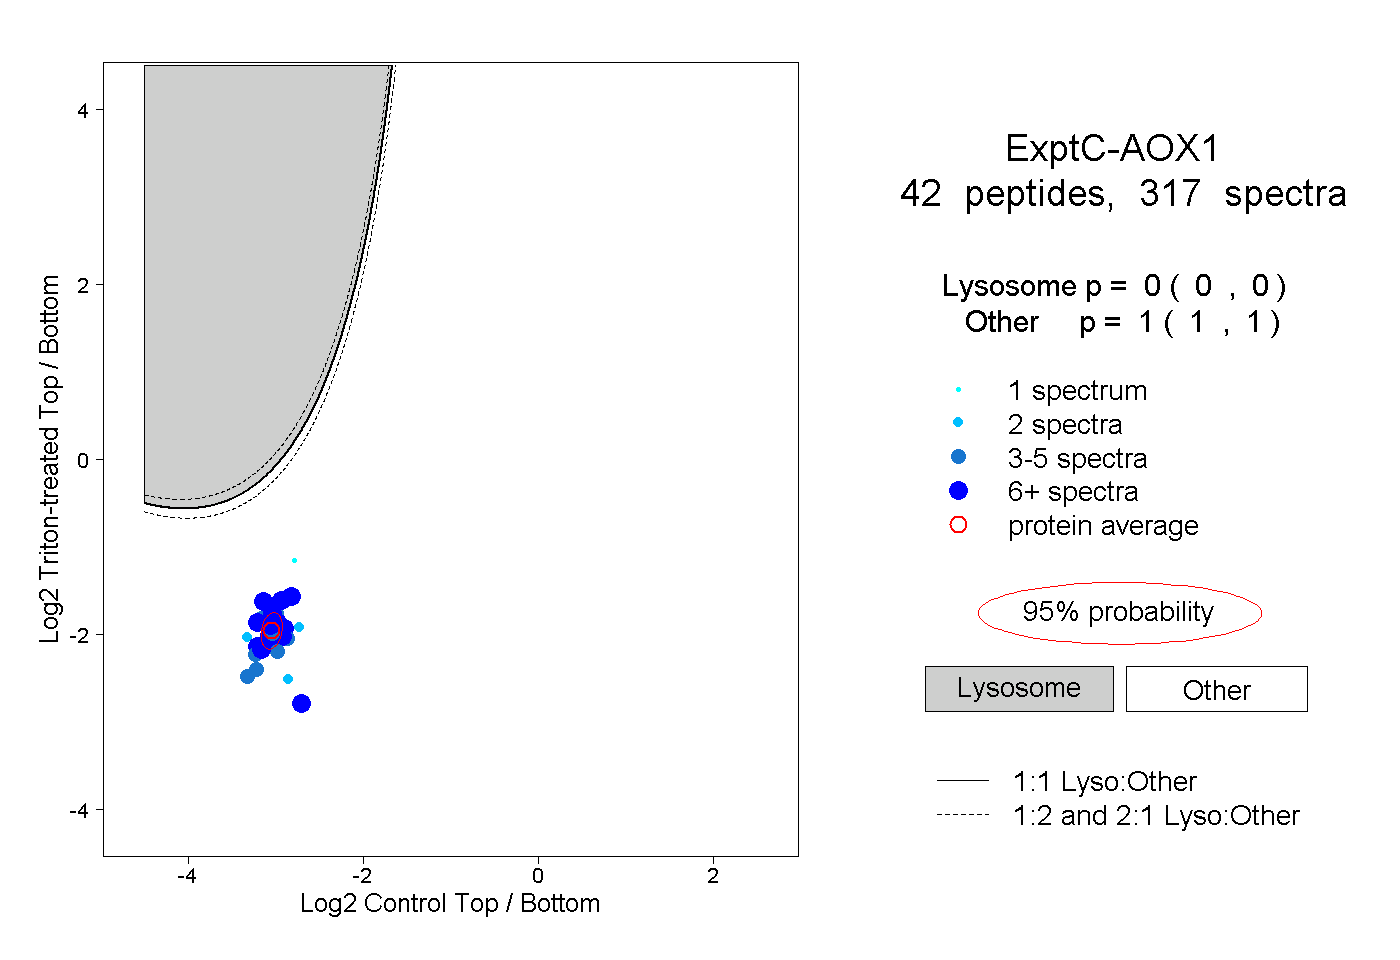
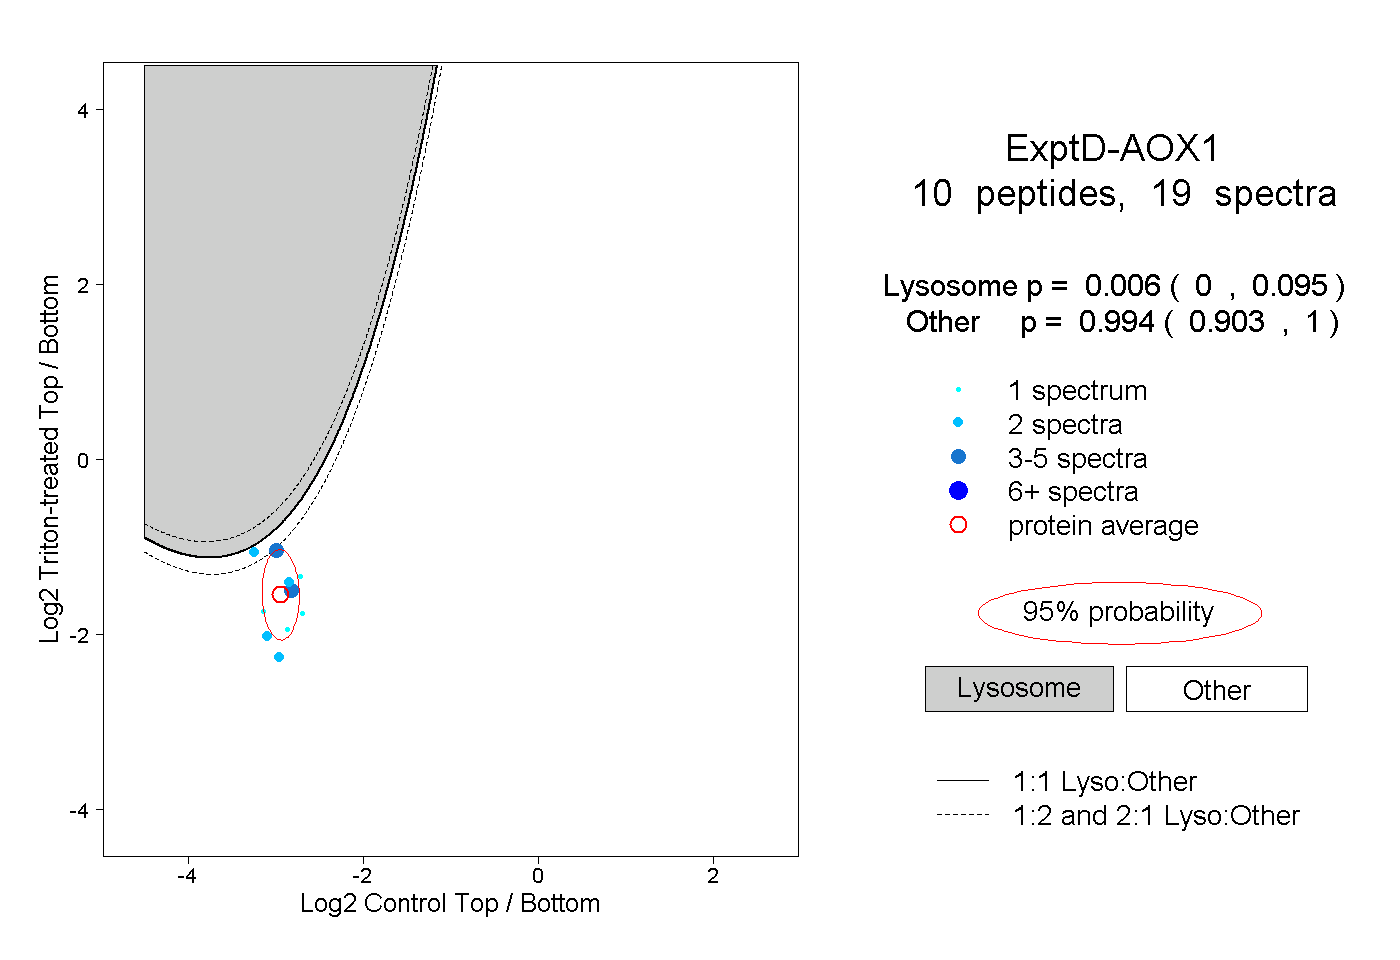
 50
50