9
9peptides
spectra
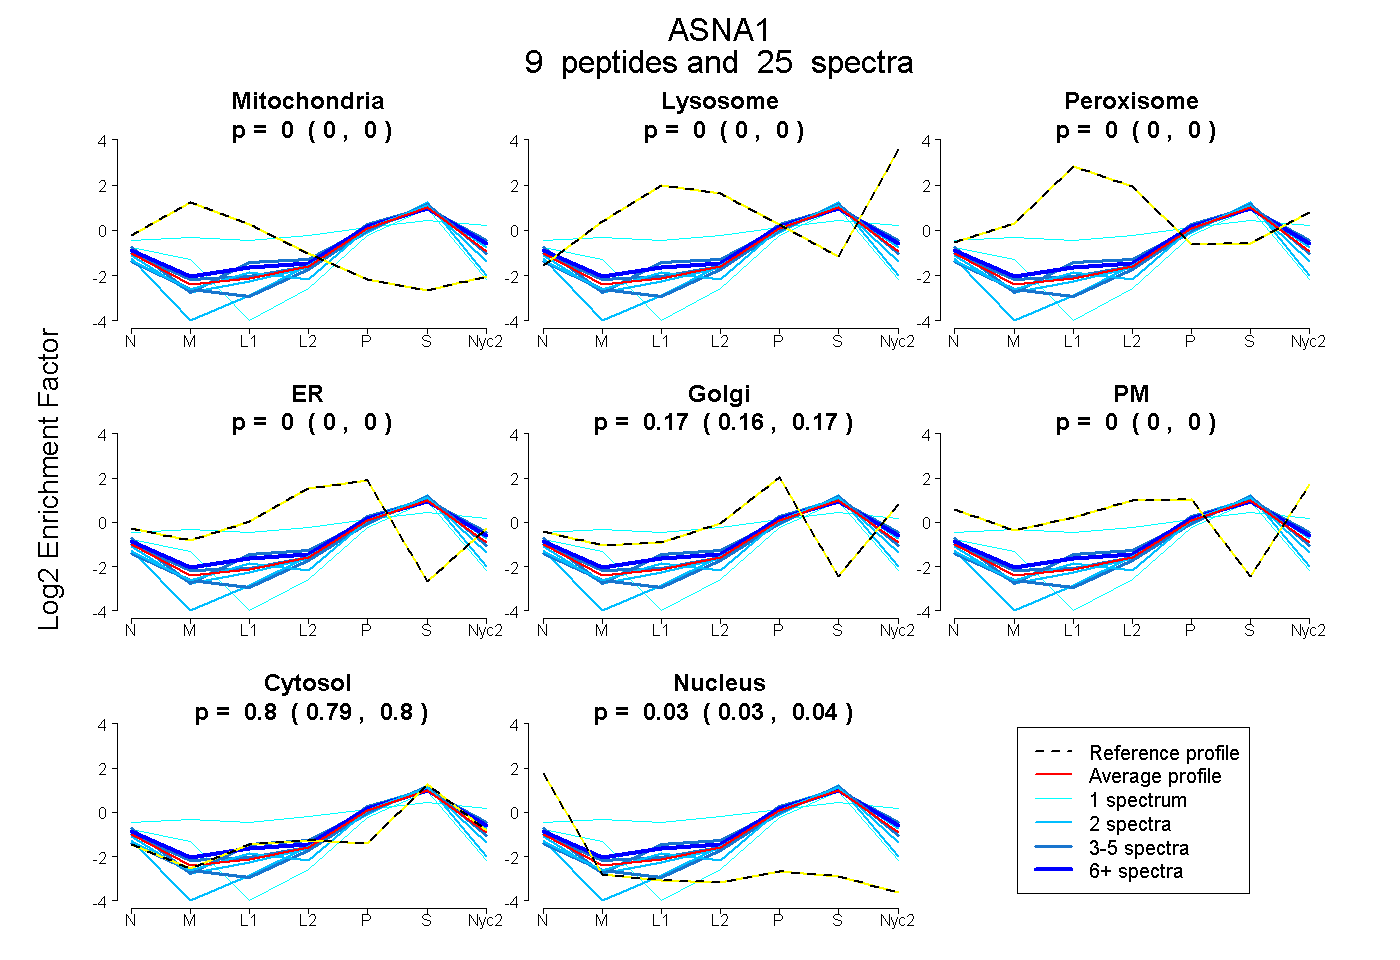
0.000 | 0.000
0.000 | 0.000
0.000 | 0.000
0.000 | 0.000
0.158 | 0.175
0.000 | 0.000
0.791 | 0.805
0.026 | 0.042
3peptides
spectra
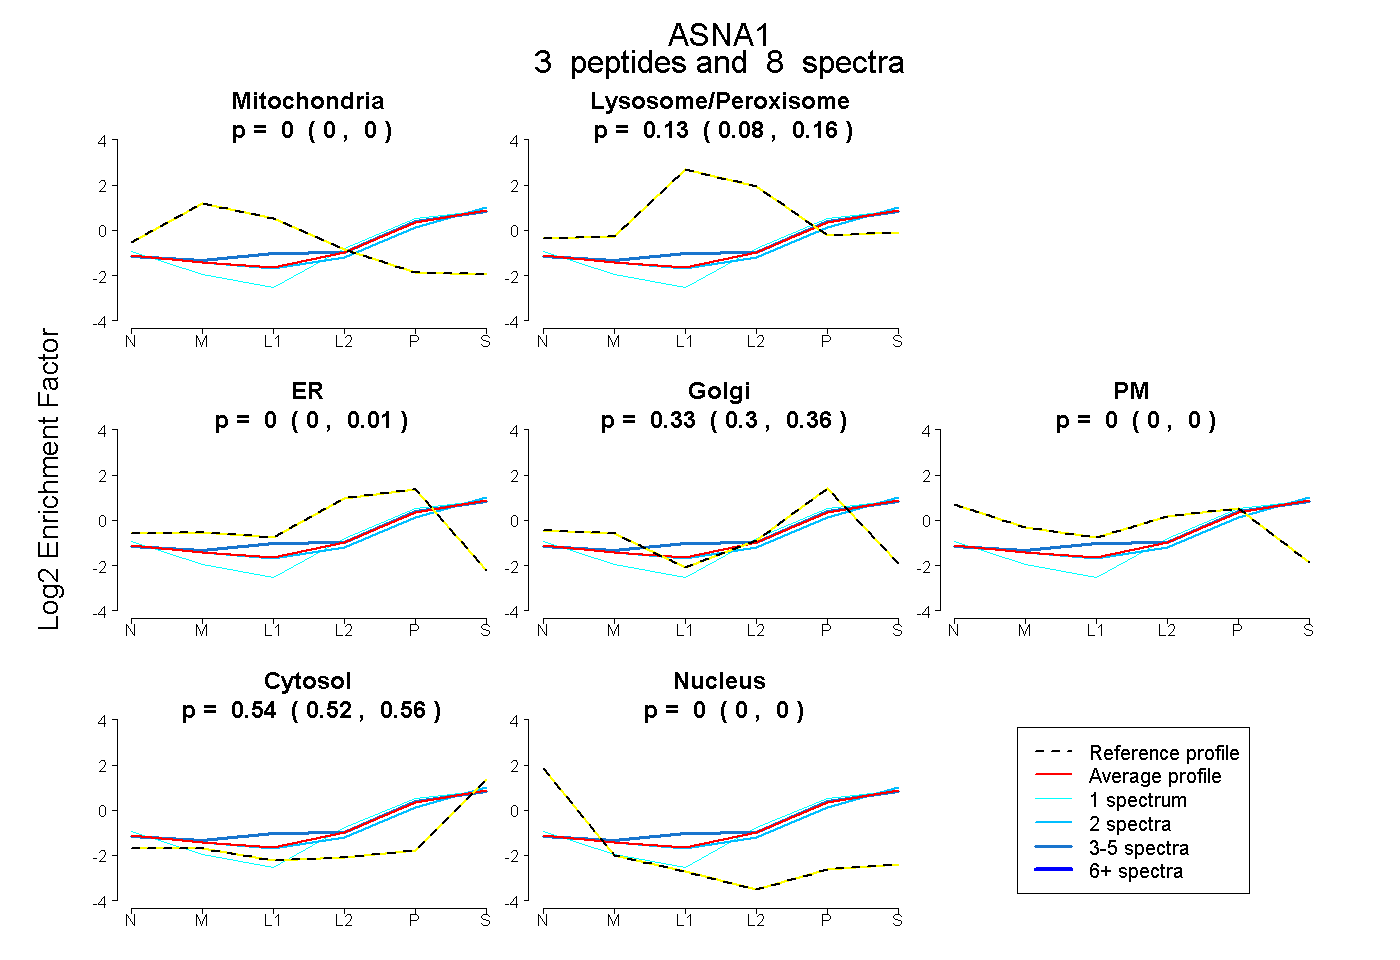
0.000 | 0.000
0.080 | 0.158
0.000 | 0.006
0.303 | 0.357
0.000 | 0.000
0.522 | 0.556
0.000 | 0.000
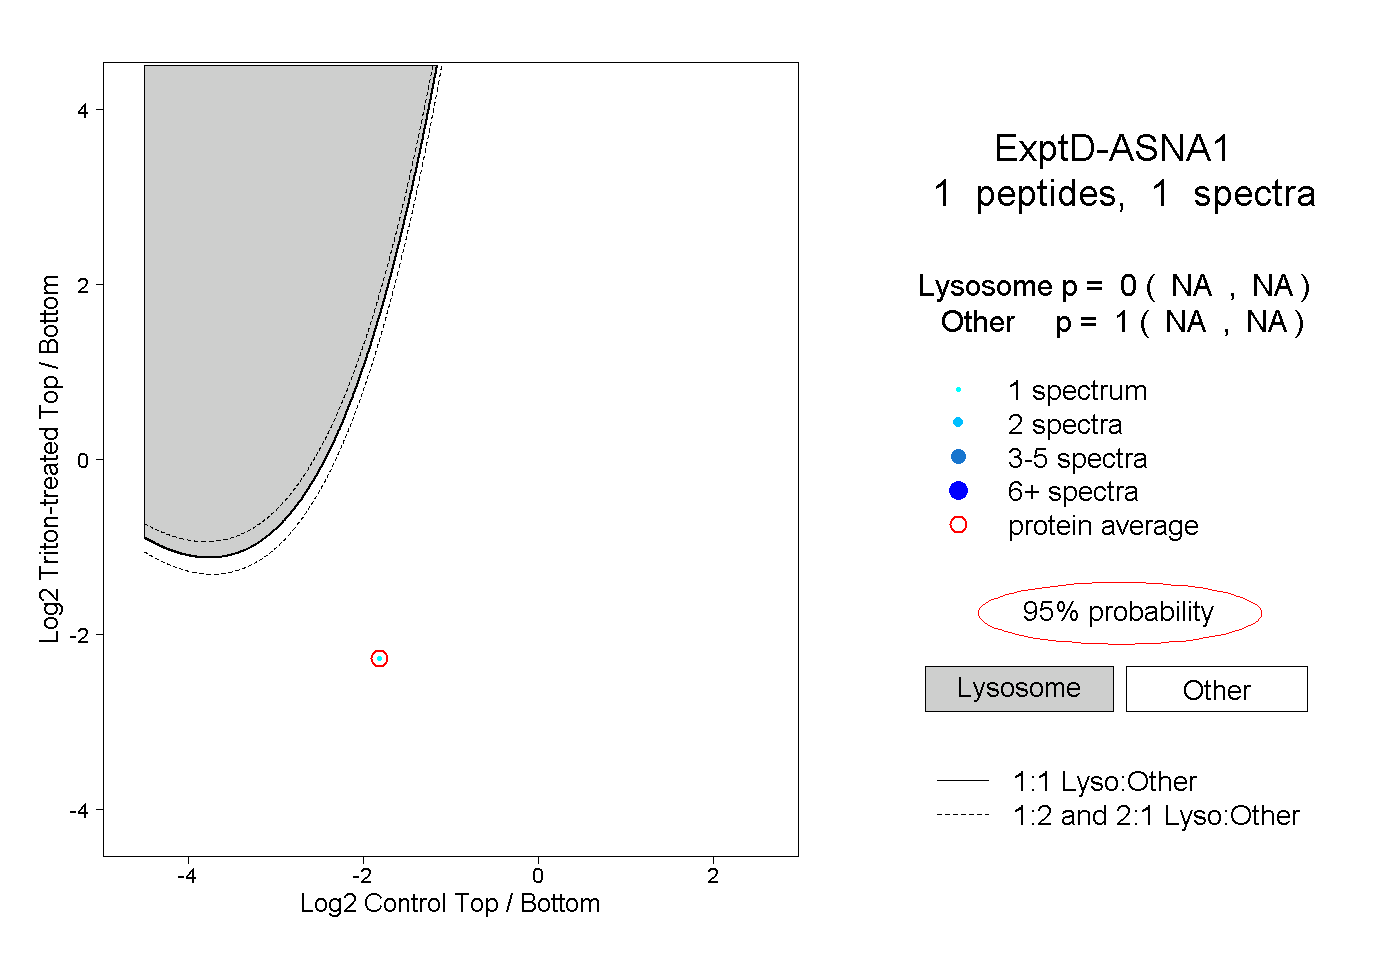
5peptides
spectra
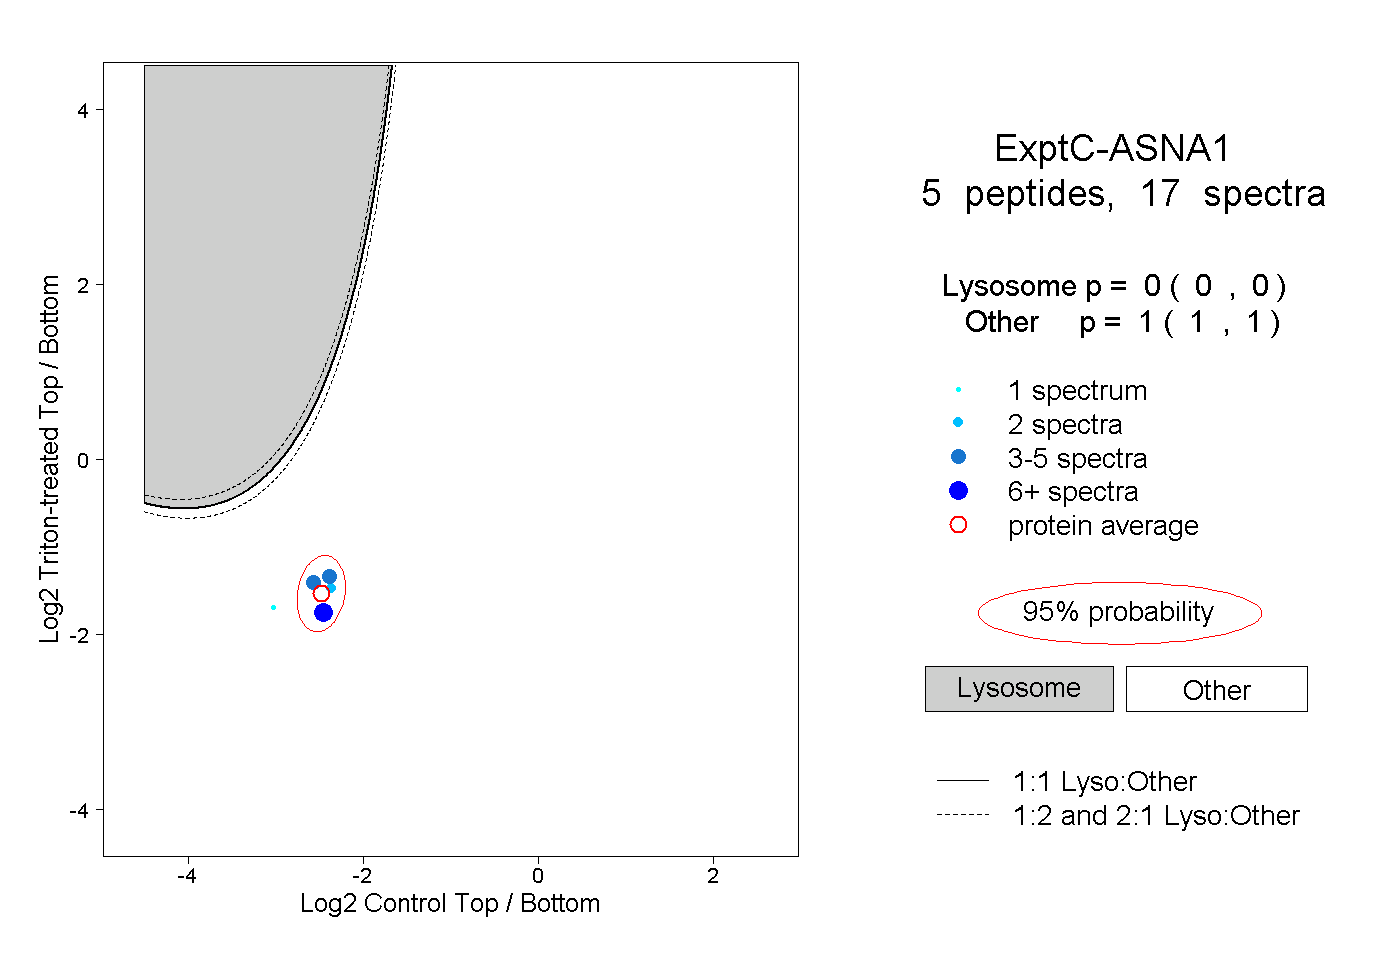
0.000 | 0.000
1.000 | 1.000