21
21peptides
spectra
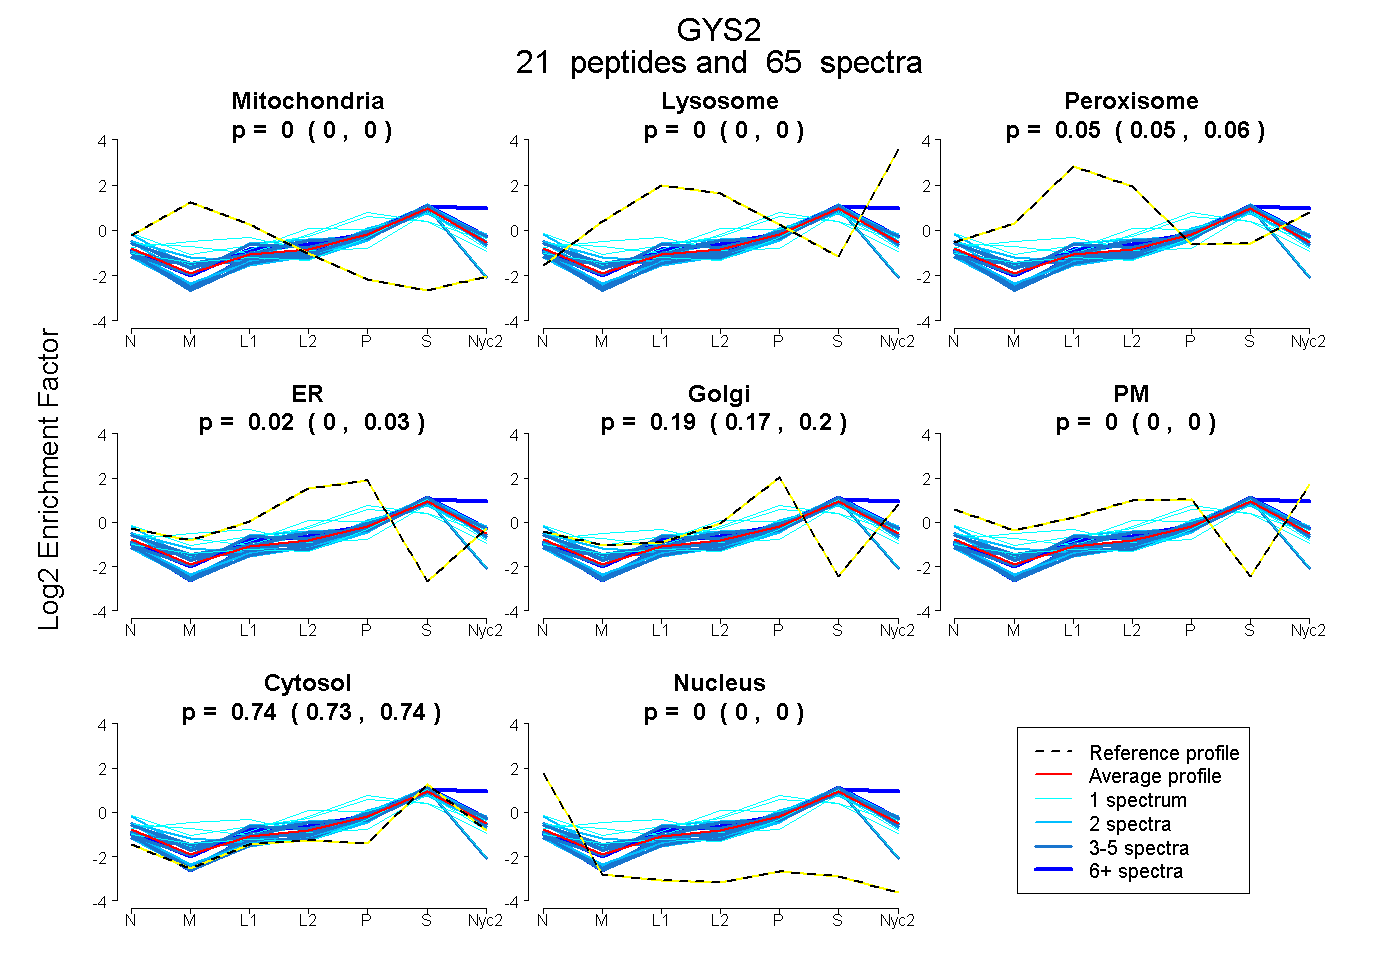
0.000 | 0.000
0.000 | 0.000
0.047 | 0.059
0.001 | 0.033
0.174 | 0.204
0.000 | 0.000
0.733 | 0.743
0.000 | 0.000
13peptides
spectra
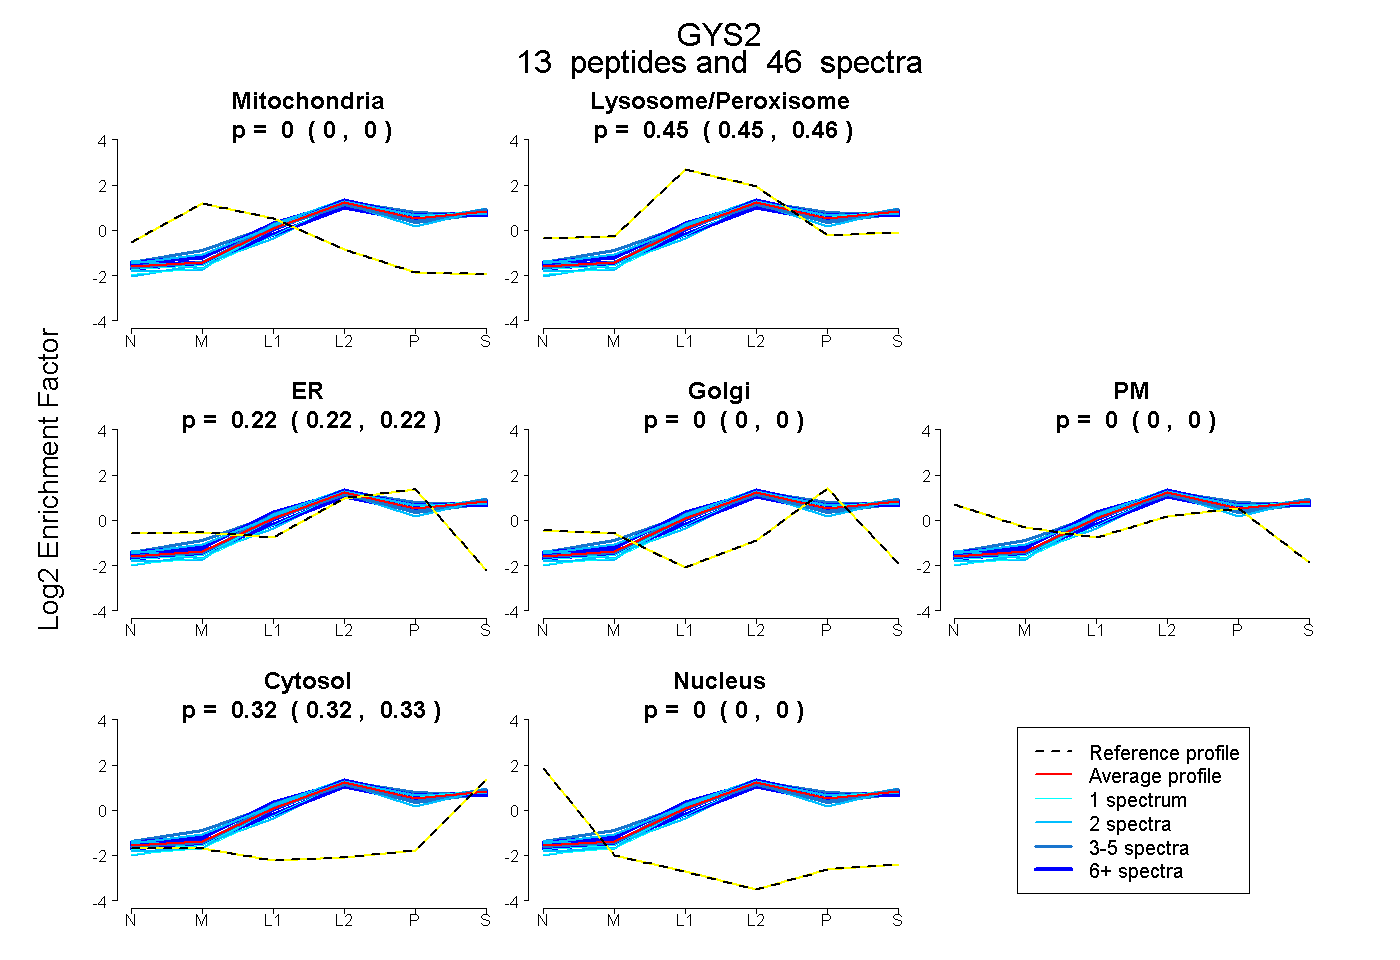
0.000 | 0.000
0.450 | 0.457
0.219 | 0.225
0.000 | 0.000
0.000 | 0.000
0.322 | 0.326
0.000 | 0.000
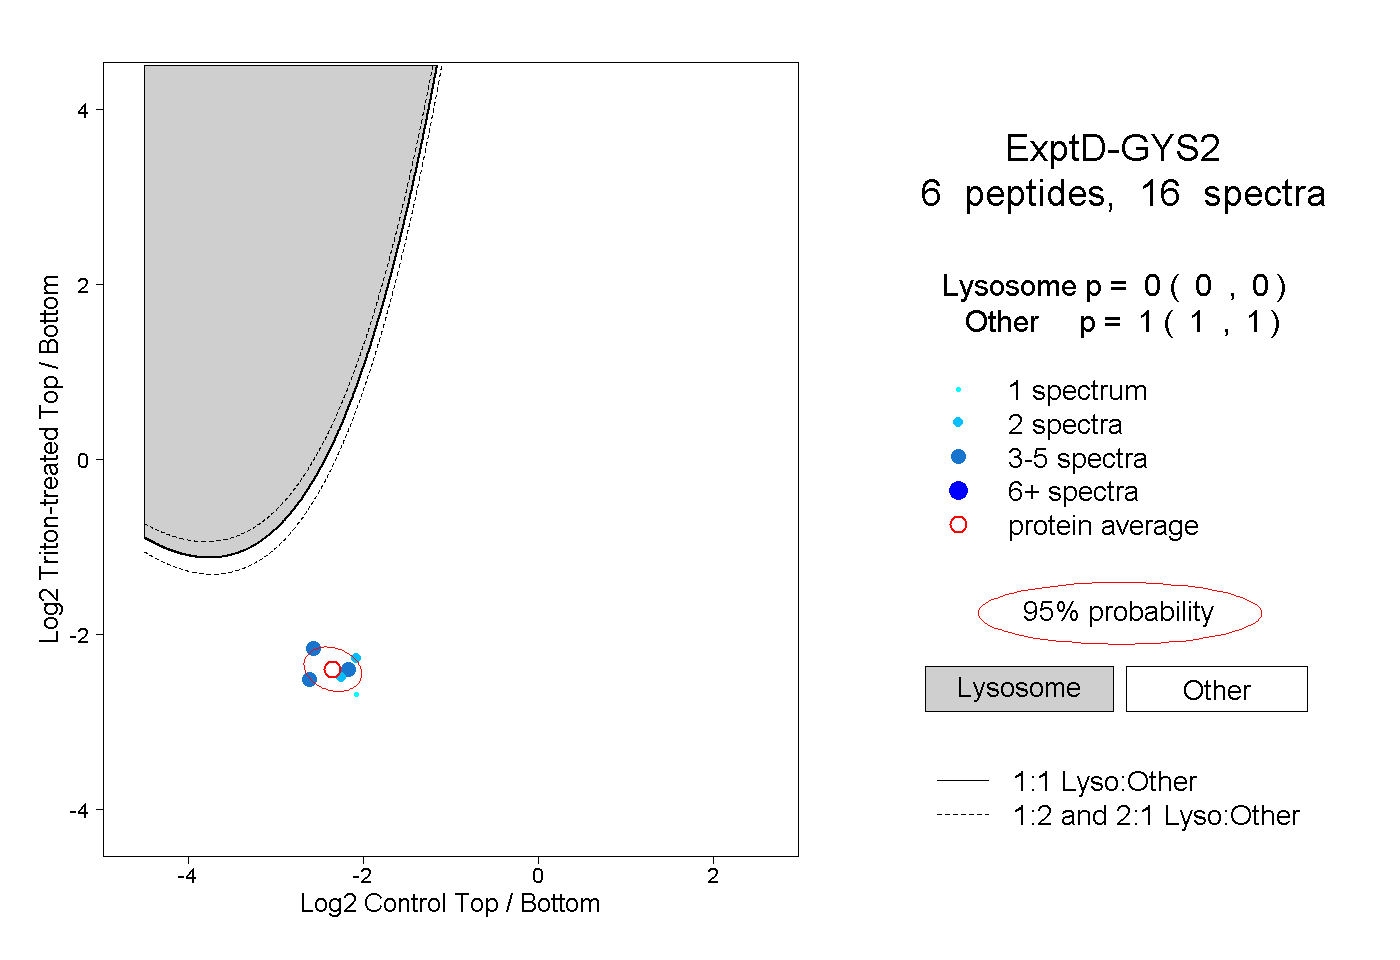
16peptides
spectra
0.000 | 0.000
1.000 | 1.000