 2
2peptides
spectra
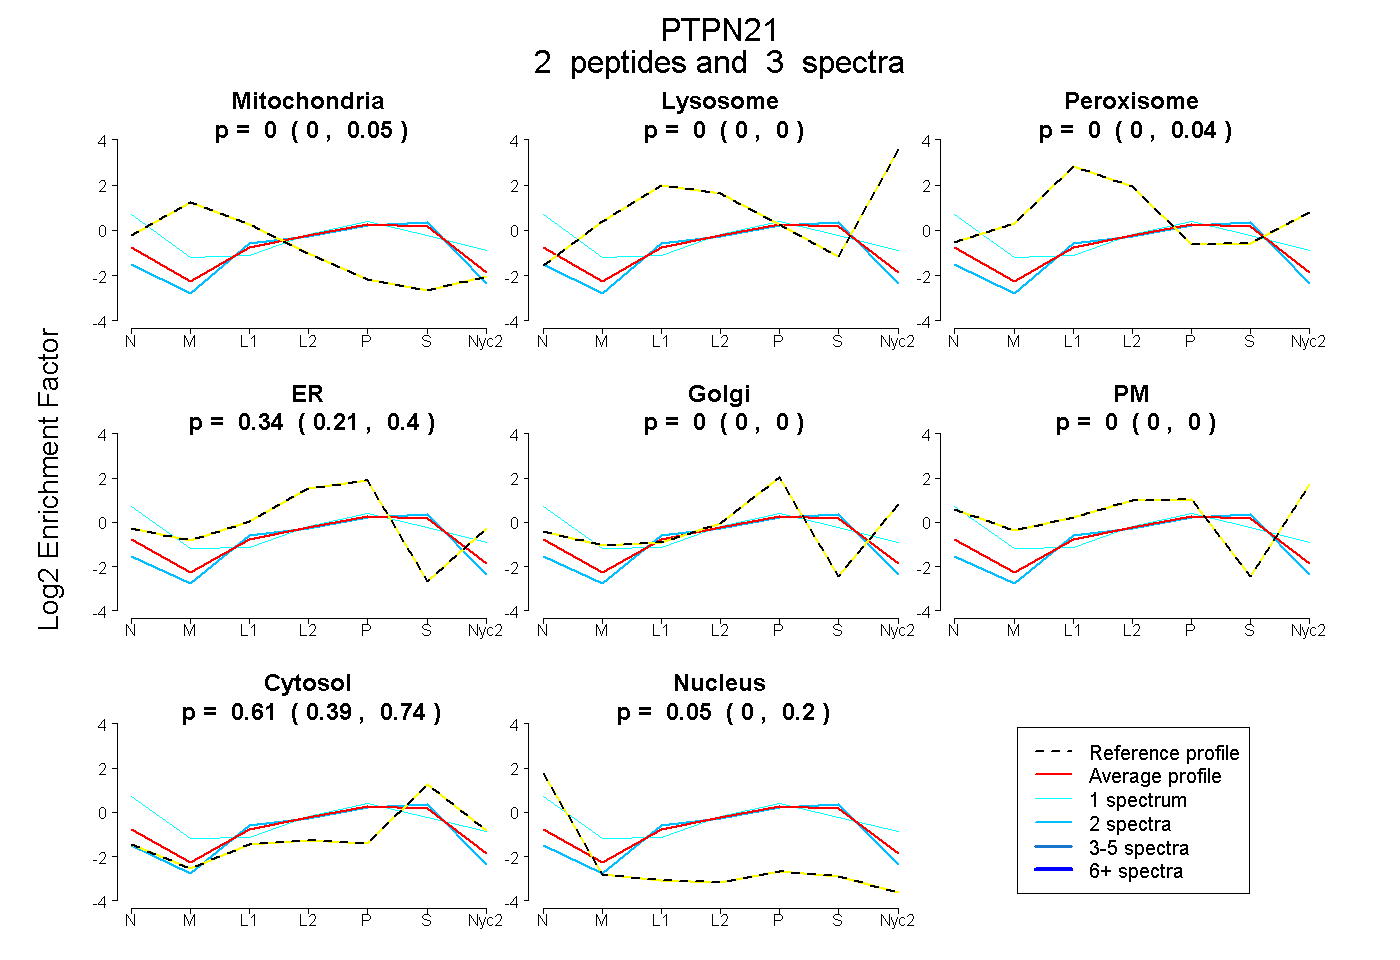
0.000 | 0.046
0.000 | 0.000
0.000 | 0.035
0.215 | 0.398
0.000 | 0.000
0.000 | 0.000
0.391 | 0.739
0.000 | 0.201
| Plot | Mito | Lyso | Perox | ER | Golgi | PM | Cytosol | Nucleus | |||||
| Expt A |
2 peptides |
3 spectra |
|
0.000 0.000 | 0.046 |
0.000 0.000 | 0.000 |
0.000 0.000 | 0.035 |
0.343 0.215 | 0.398 |
0.000 0.000 | 0.000 |
0.000 0.000 | 0.000 |
0.606 0.391 | 0.739 |
0.051 0.000 | 0.201 |
| 2 spectra, ENNTGYINASHIK | 0.000 | 0.000 | 0.000 | 0.279 | 0.000 | 0.000 | 0.703 | 0.018 | ||
| 1 spectrum, LEQGTVFTEYER | 0.000 | 0.000 | 0.000 | 0.281 | 0.000 | 0.199 | 0.395 | 0.125 |
| Plot | Lyso | Other | |||||||||||
| Expt C |
2 peptides |
4 spectra |
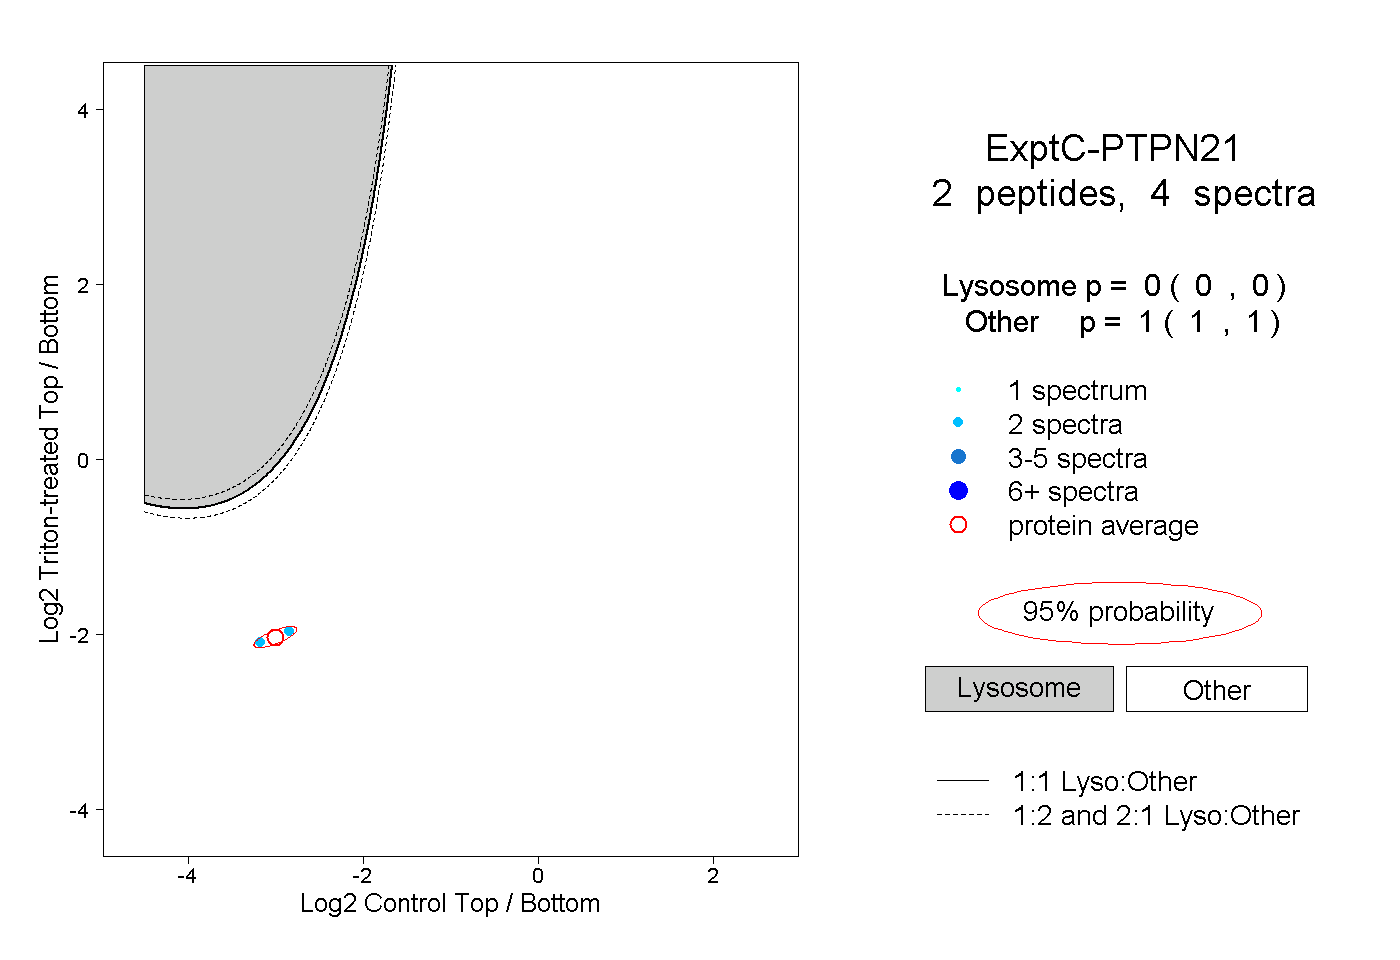 |
0.000 0.000 | 0.000 |
1.000 1.000 | 1.000 |