 5
5peptides
spectra
0.883 | 0.925
0.000 | 0.000
0.000 | 0.000
0.022 | 0.103
0.000 | 0.000
0.000 | 0.069
0.000 | 0.000
0.000 | 0.000
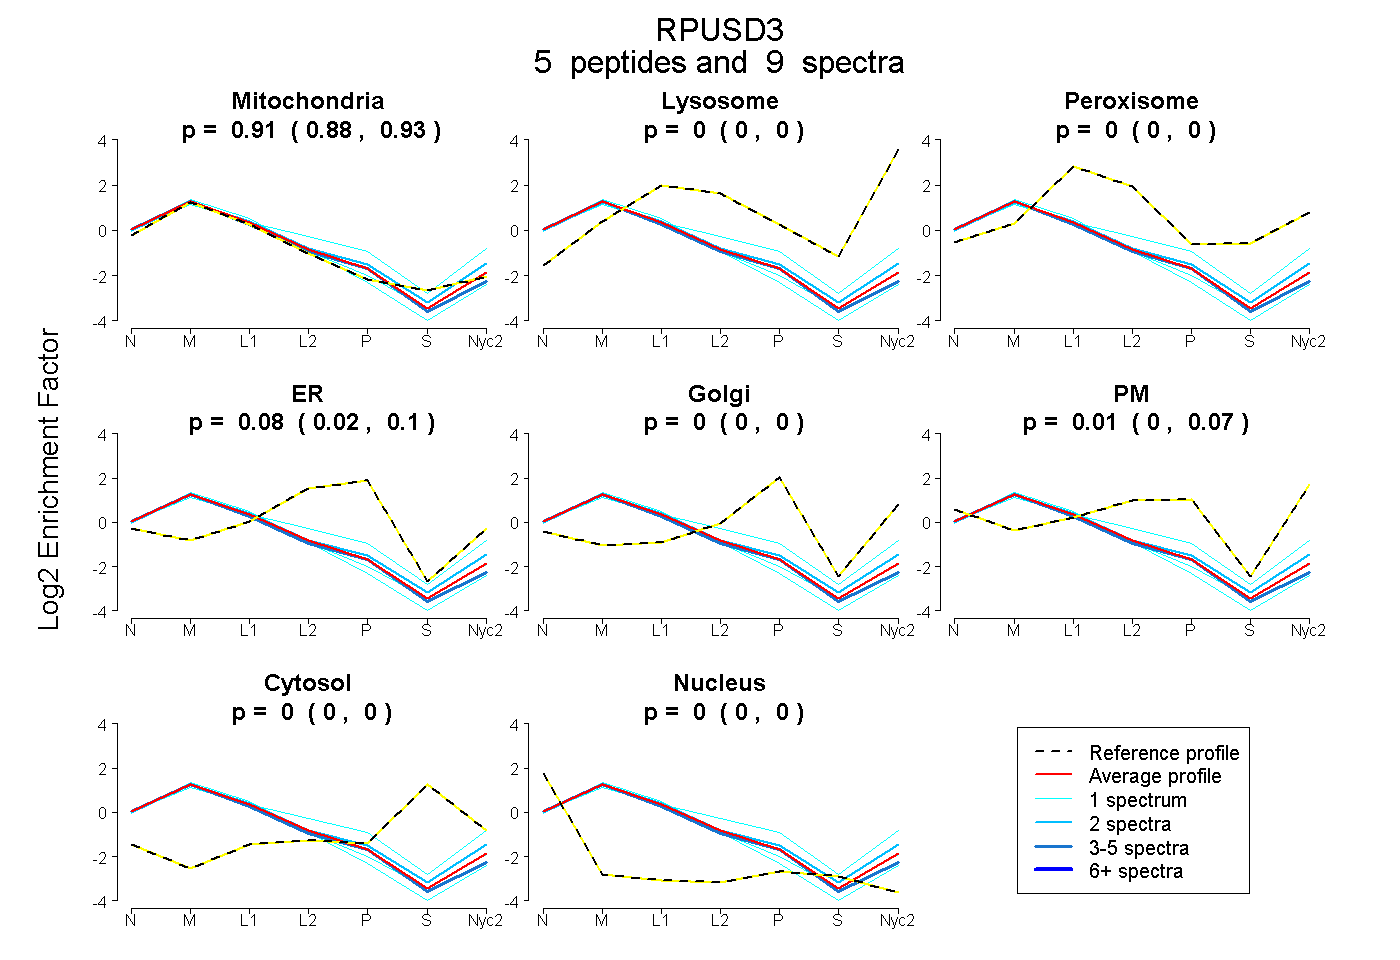
| Plot | Mito | Lyso | Perox | ER | Golgi | PM | Cytosol | Nucleus | |||||
| Expt A |
5 peptides |
9 spectra |
|
0.906 0.883 | 0.925 |
0.000 0.000 | 0.000 |
0.000 0.000 | 0.000 |
0.079 0.022 | 0.103 |
0.000 0.000 | 0.000 |
0.015 0.000 | 0.069 |
0.000 0.000 | 0.000 |
0.000 0.000 | 0.000 |
| 1 spectrum, AENLGLEELAQVLR | 0.998 | 0.000 | 0.000 | 0.000 | 0.000 | 0.000 | 0.000 | 0.002 | ||
| 2 spectra, QVLDEALLR | 0.849 | 0.000 | 0.000 | 0.000 | 0.000 | 0.151 | 0.000 | 0.000 | ||
| 4 spectra, LLLPGTRPR | 0.918 | 0.000 | 0.000 | 0.060 | 0.000 | 0.000 | 0.000 | 0.022 | ||
| 1 spectrum, FLWPAETTKPQR | 0.959 | 0.000 | 0.000 | 0.017 | 0.000 | 0.023 | 0.000 | 0.000 | ||
| 1 spectrum, FFTHSR | 0.670 | 0.004 | 0.000 | 0.012 | 0.000 | 0.314 | 0.000 | 0.000 |
| Plot | Mito | Lyso or Perox | ER | Golgi | PM | Cytosol | Nucleus | ||||||
| Expt B |
3 peptides |
4 spectra |
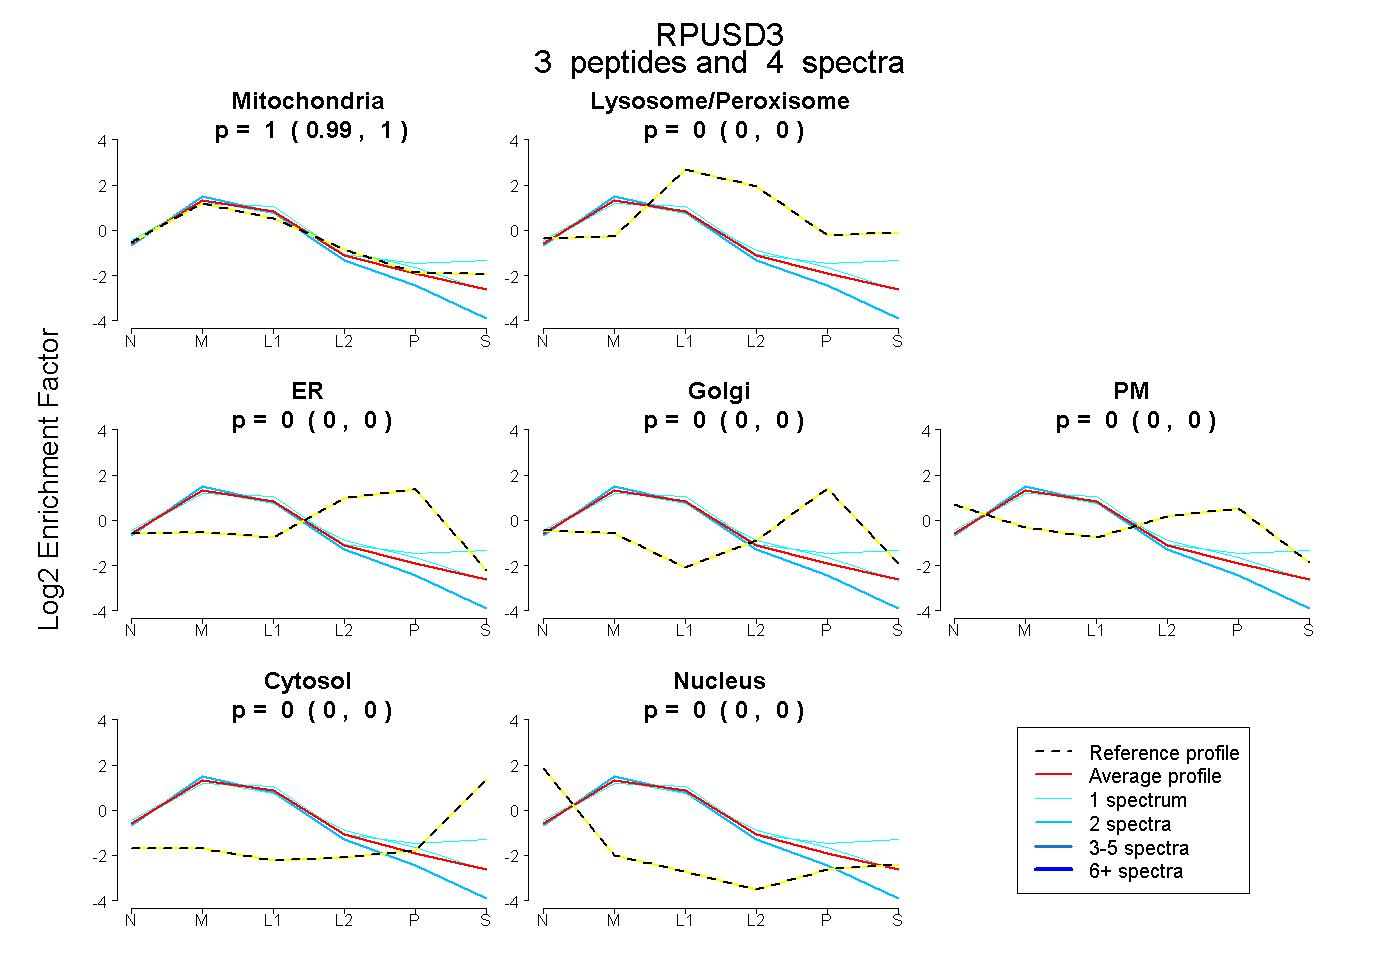 |
1.000 0.991 | 1.000 |
0.000 0.000 | 0.000 |
0.000 0.000 | 0.000 |
0.000 0.000 | 0.000 |
0.000 0.000 | 0.000 |
0.000 0.000 | 0.000 |
0.000 0.000 | 0.000 |
|||
| Plot | Lyso | Other | |||||||||||
| Expt C |
3 peptides |
6 spectra |
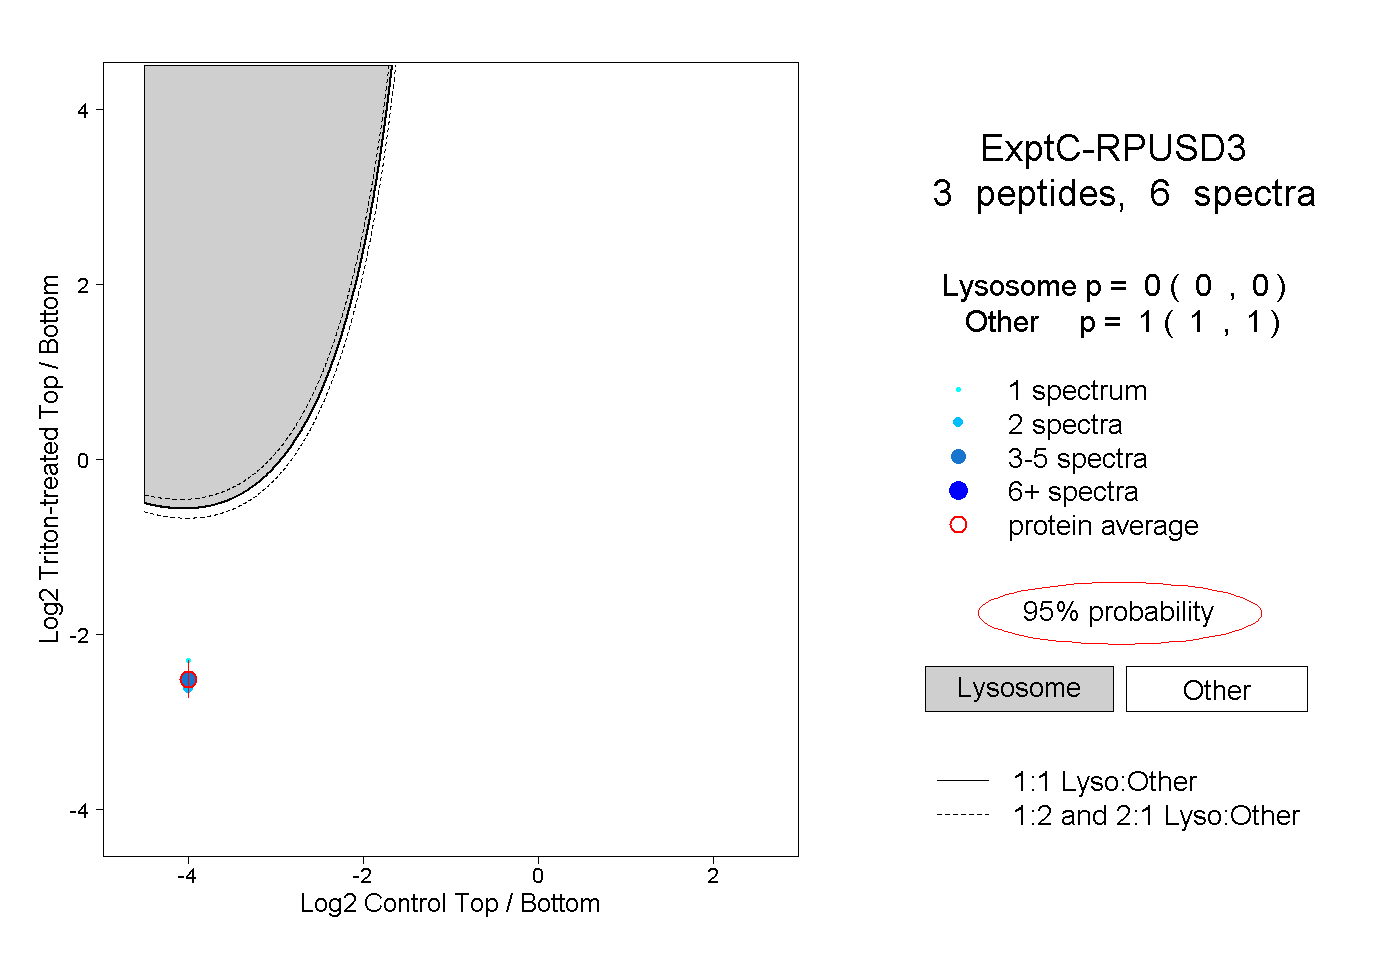 |
0.000 0.000 | 0.000 |
1.000 1.000 | 1.000 |
||||||||
| Plot | Lyso | Other | |||||||||||
| Expt D |
2 peptides |
3 spectra |
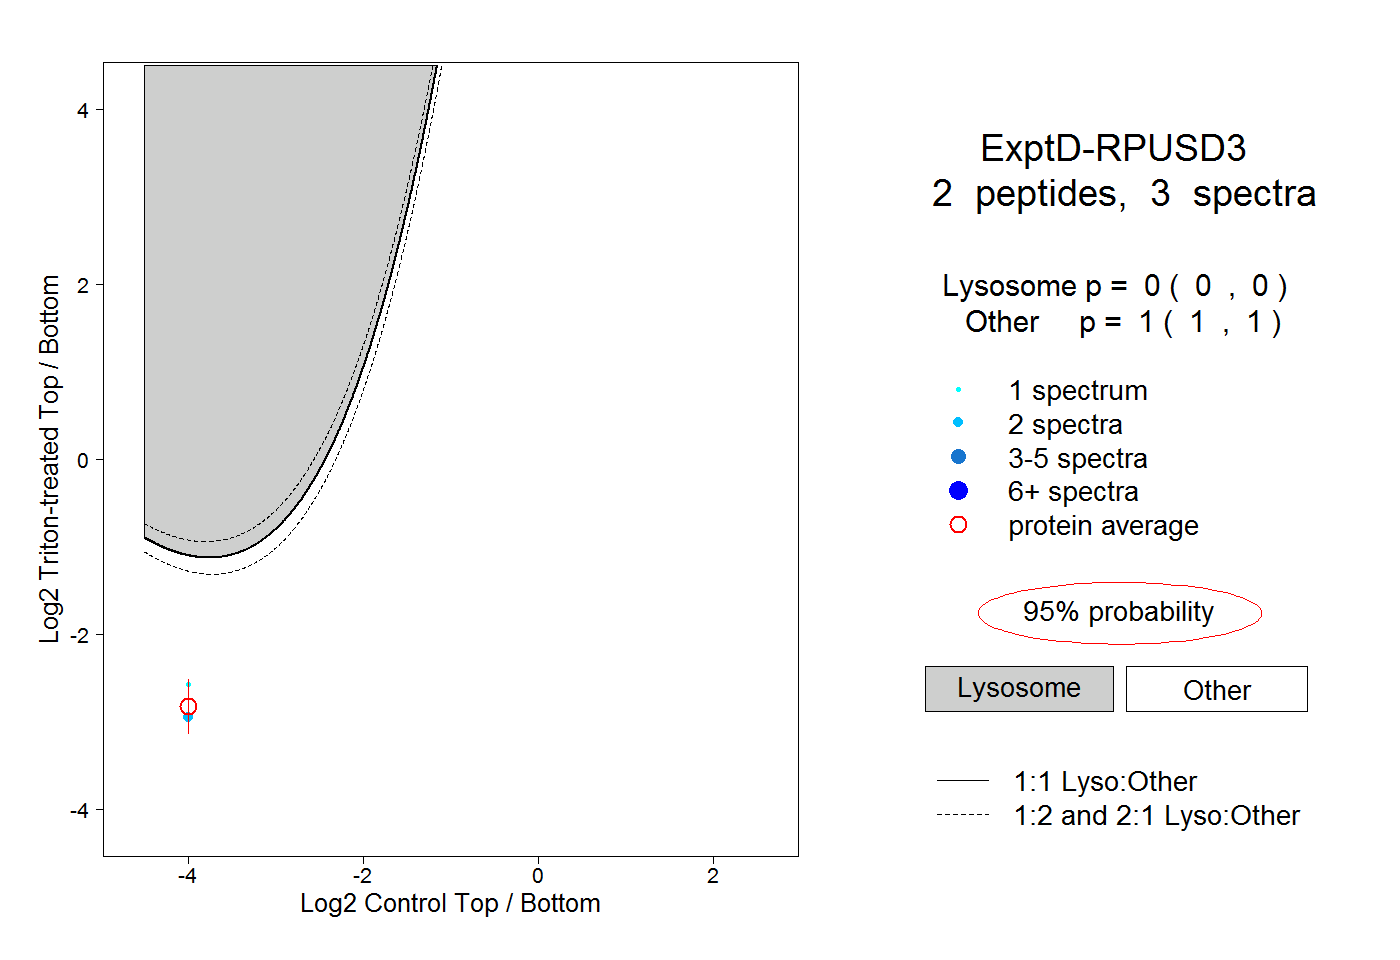 |
0.000 0.000 | 0.000 |
1.000 1.000 | 1.000 |