 5
5peptides
spectra
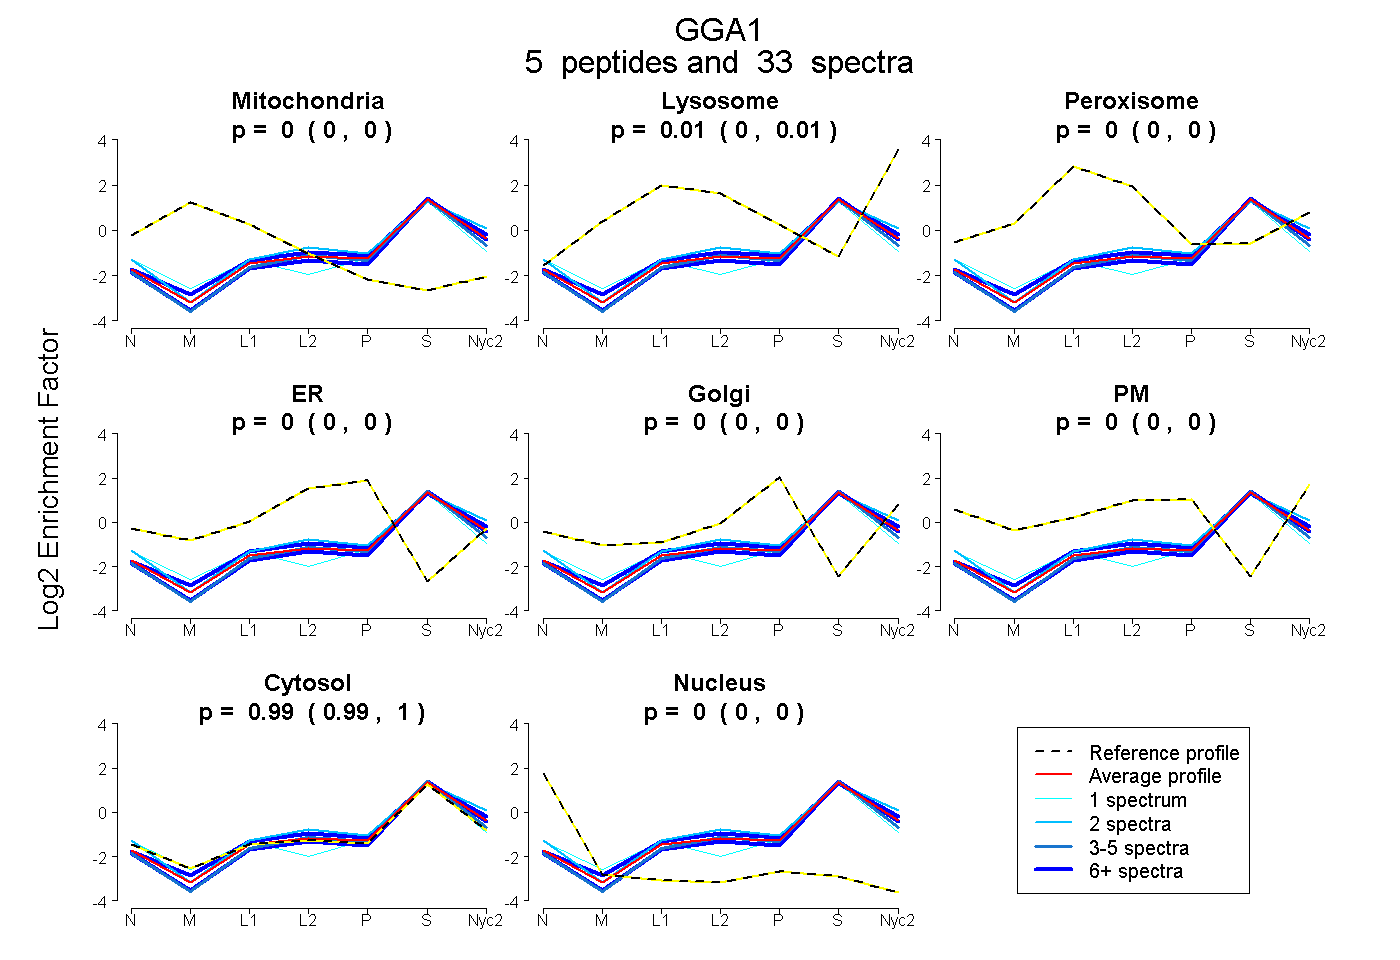
0.000 | 0.000
0.001 | 0.012
0.000 | 0.000
0.000 | 0.000
0.000 | 0.000
0.000 | 0.000
0.987 | 0.998
0.000 | 0.000
3peptides
spectra
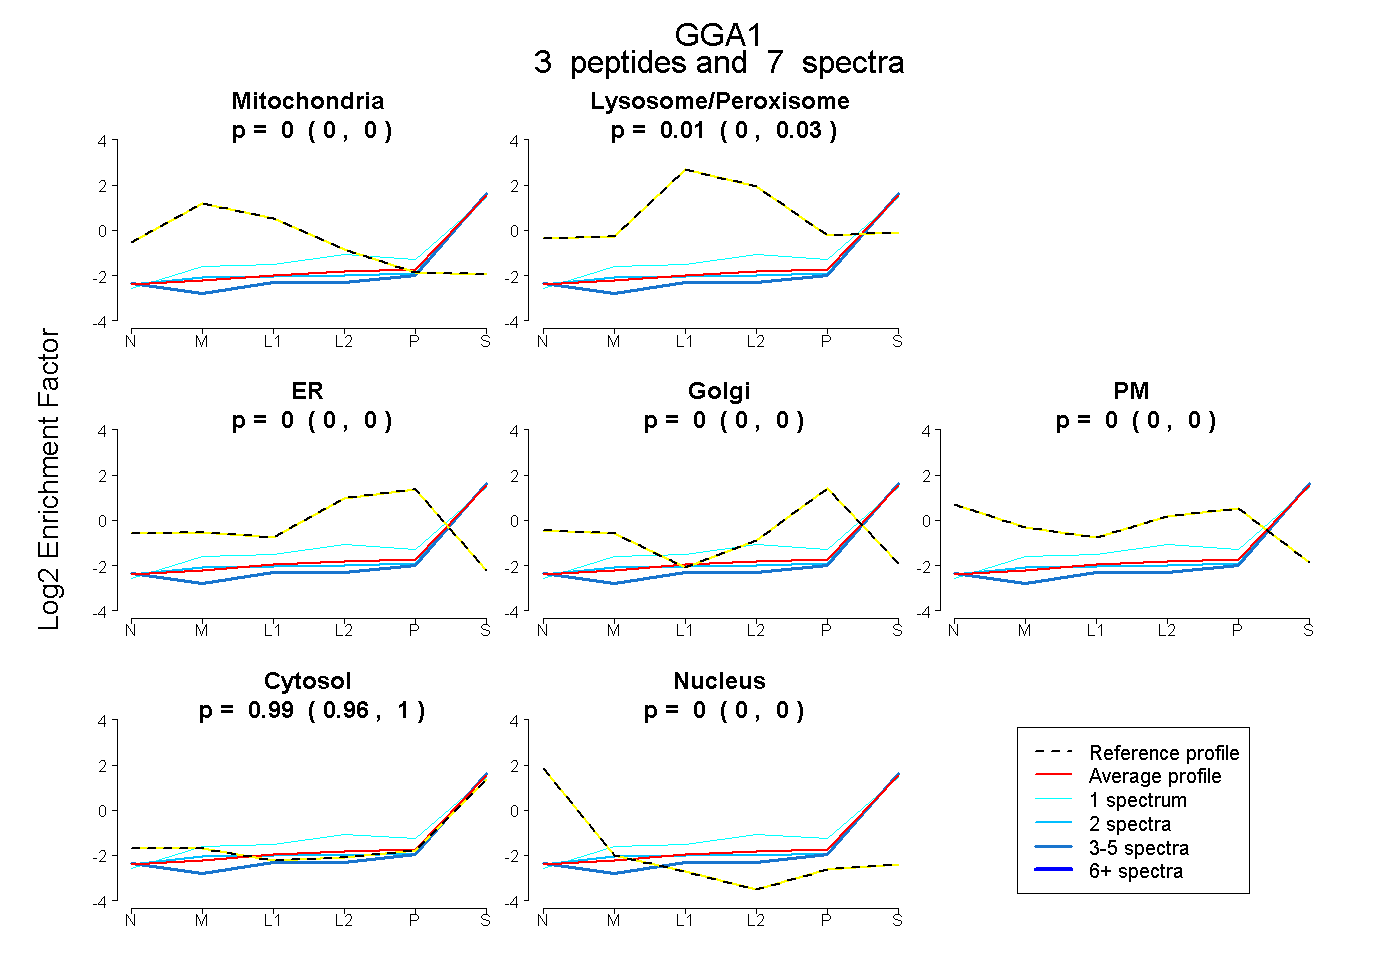
0.000 | 0.000
0.000 | 0.030
0.000 | 0.000
0.000 | 0.000
0.000 | 0.000
0.965 | 1.000
0.000 | 0.000
5peptides
spectra
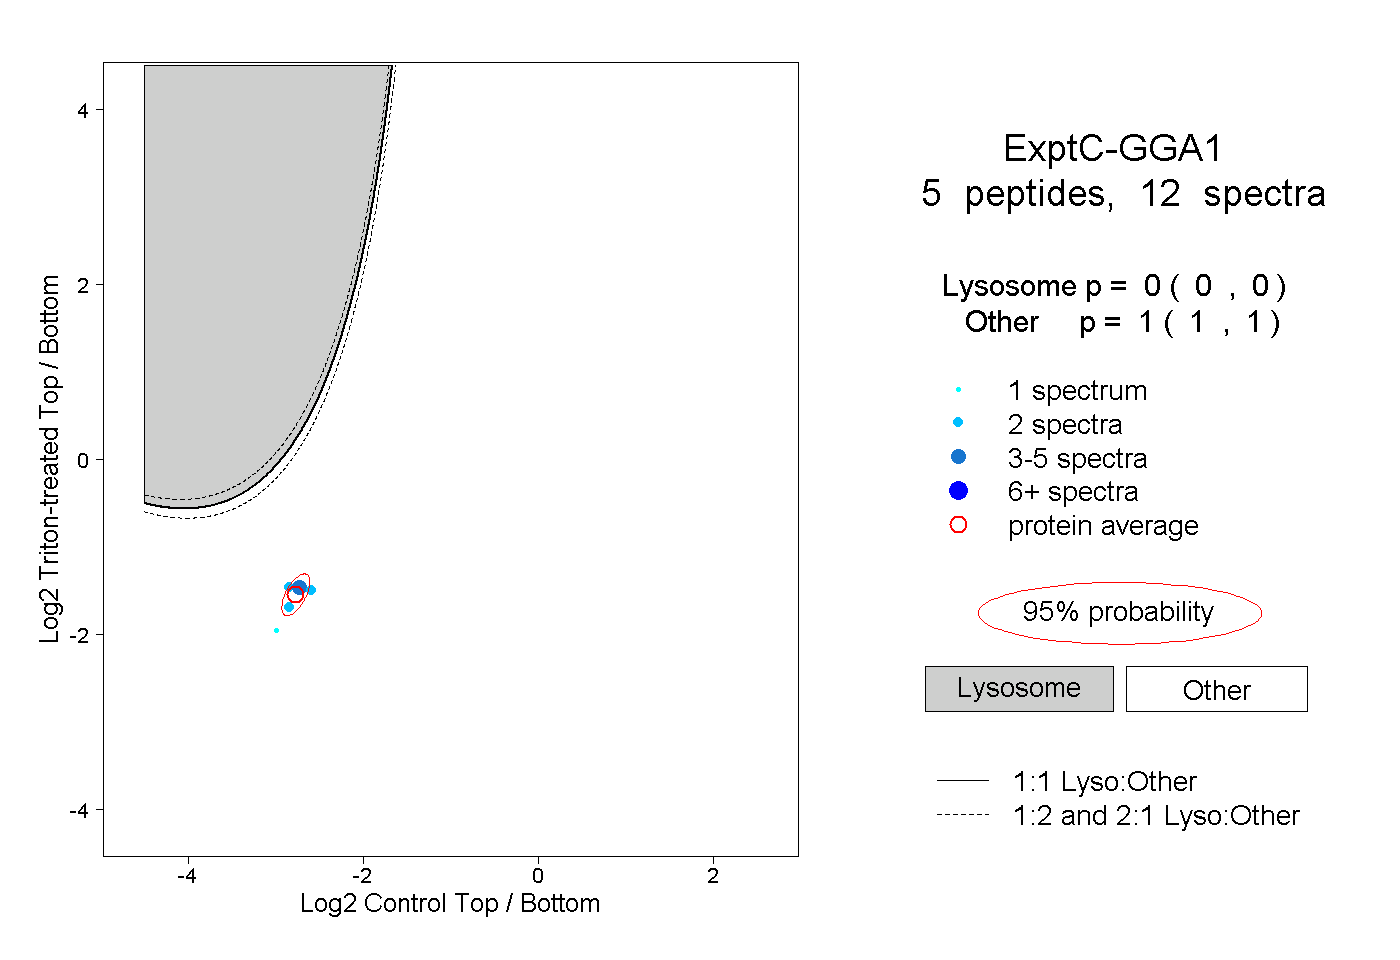
0.000 | 0.000
1.000 | 1.000
1peptide
spectrum
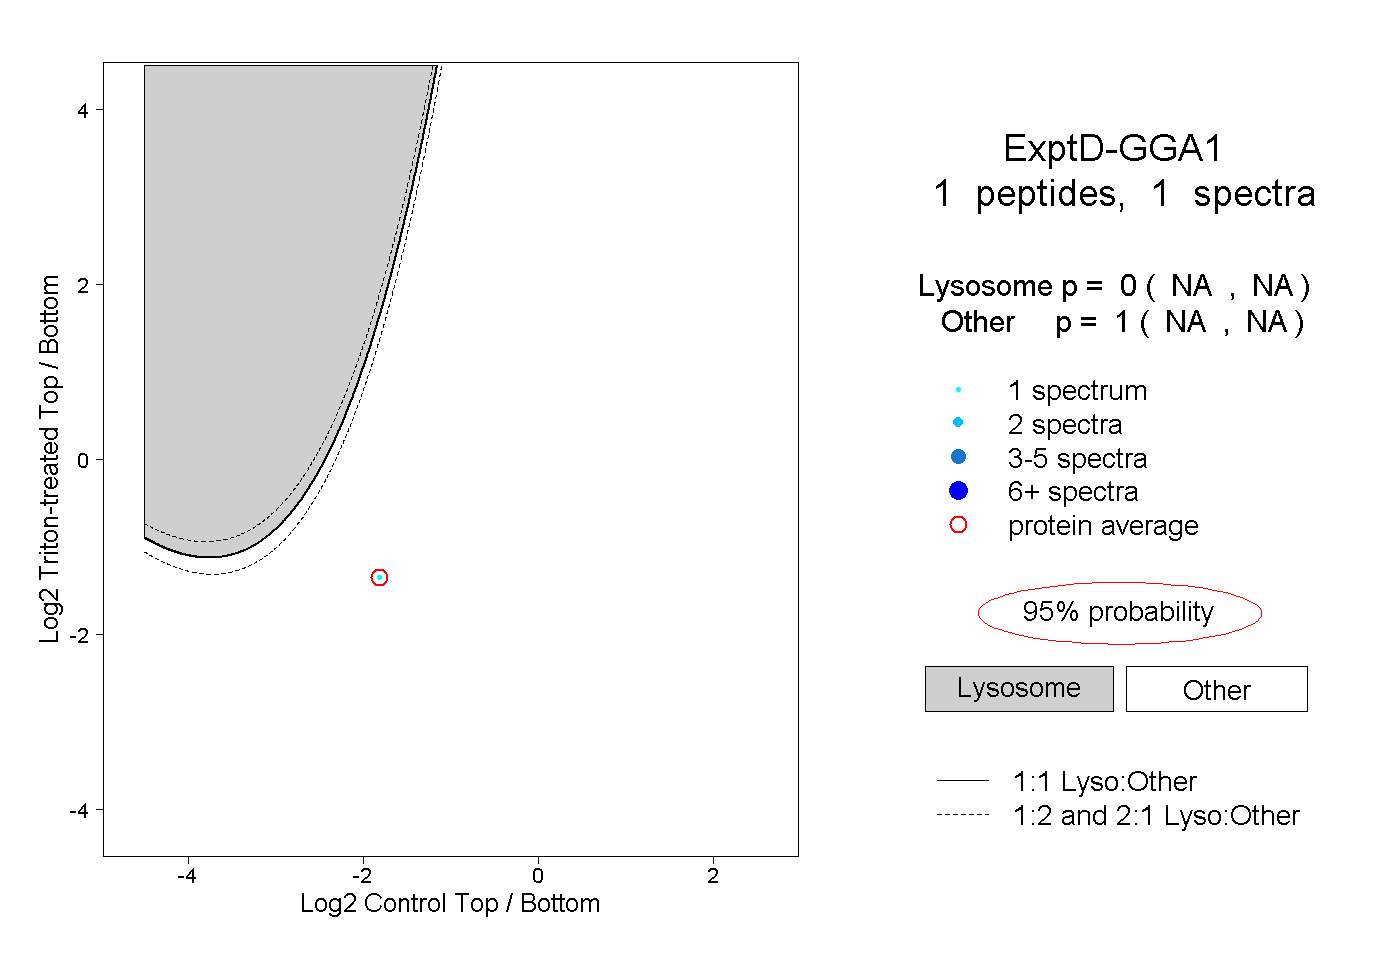
NA | NA
NA | NA